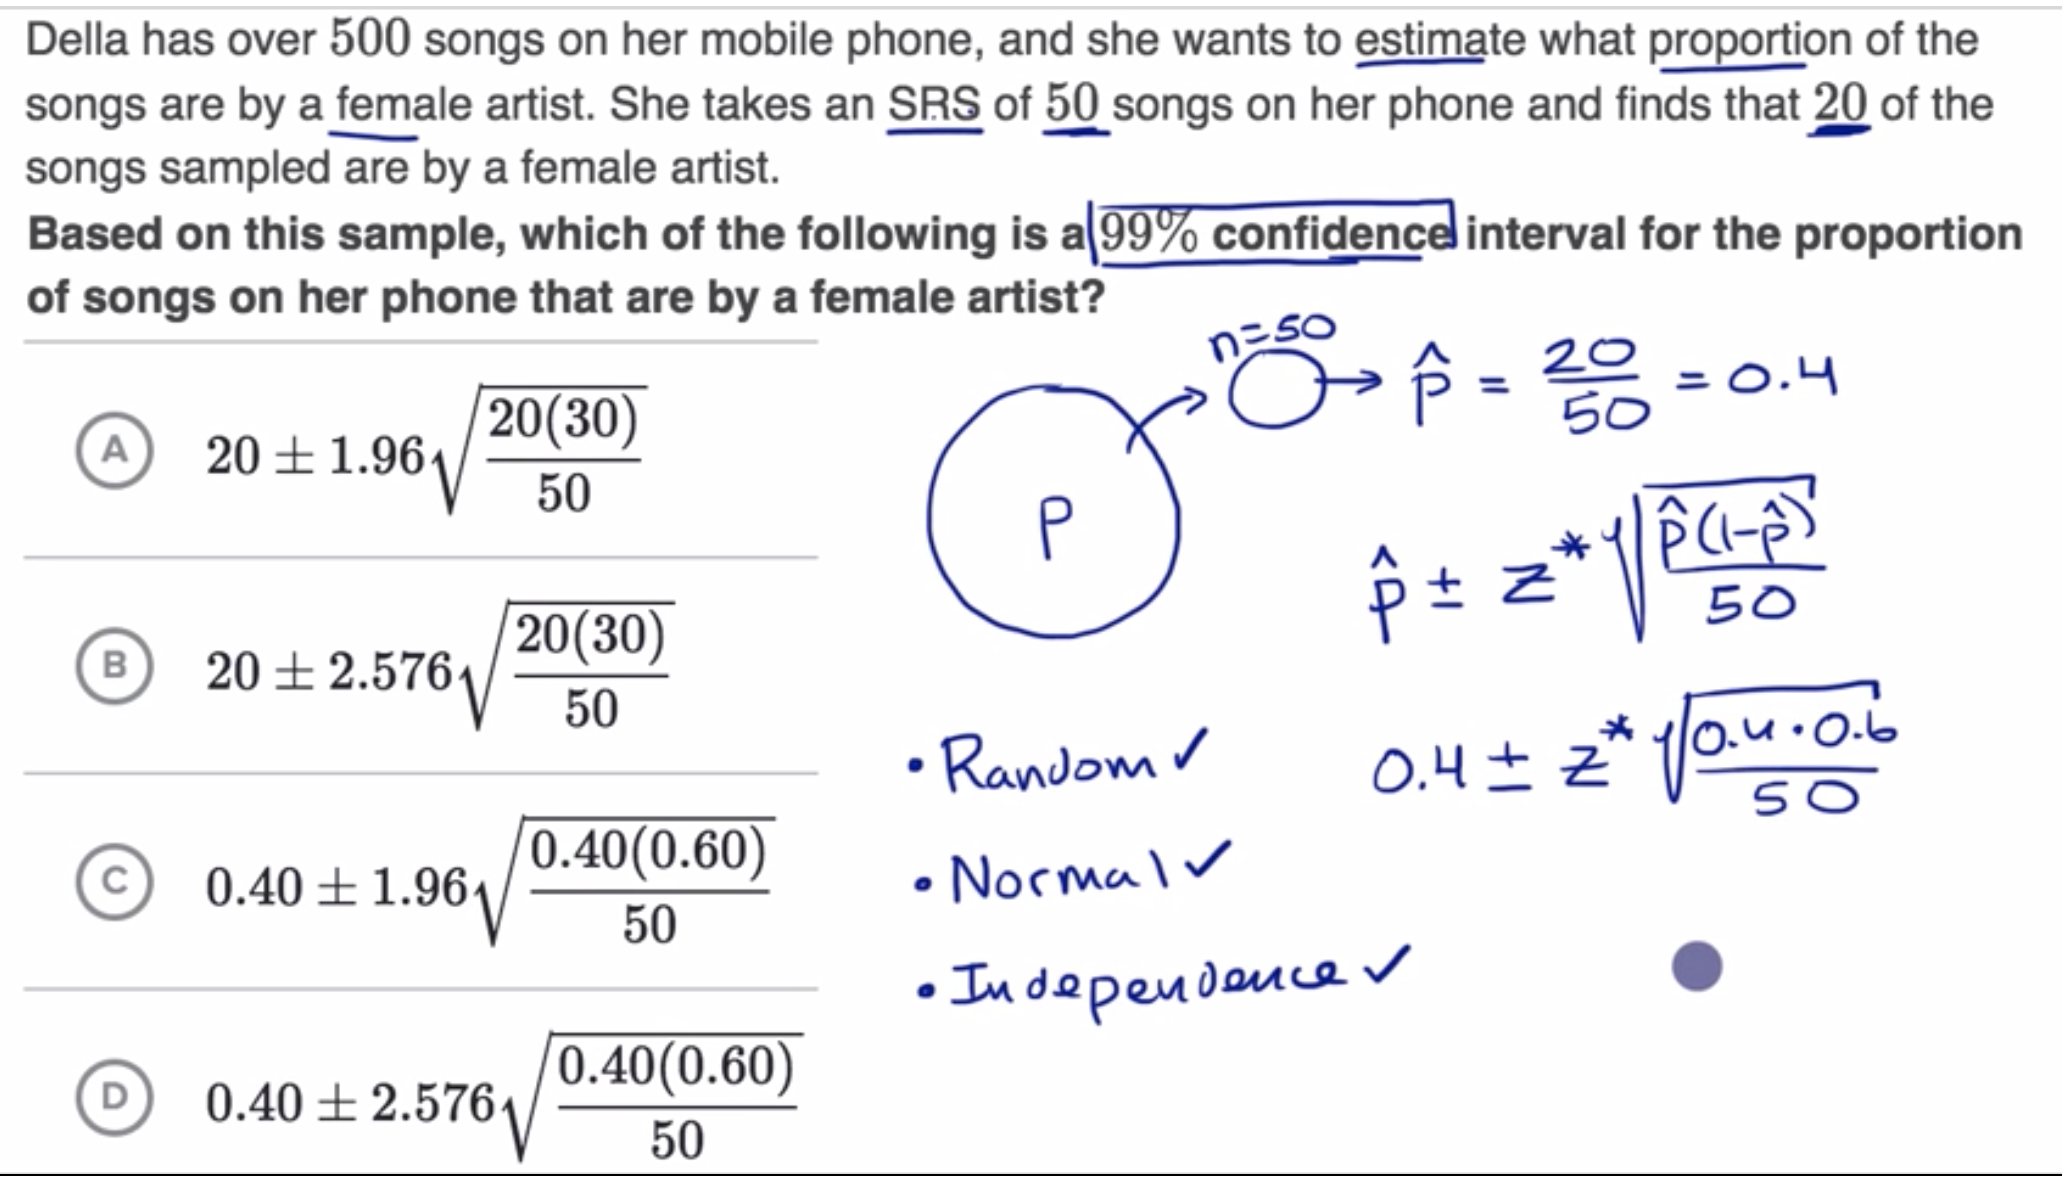
12 Example constructing and interpreting a confidence interval for p
12 Example constructing and interpreting a confidence interval for p#
%%html
<iframe width="700" height="400" src="https://www.youtube.com/embed/sjG9Ns_8x6c/" frameborder="0" allowfullscreen></iframe>
import numpy as np
import pandas as pd
from pandas import Series, DataFrame
import matplotlib.pyplot as plt
import seaborn as sns
from scipy import stats, special
x = np.array(20 * [1] + (50 - 20)* [0])
xbar = x.mean()
s = x.std(ddof=1) / np.sqrt(len(x))
z = stats.norm.pdf(0.99) # need improvement
xbar - z * s, xbar + z * s
(0.38289623834908926, 0.4171037616509108)
stats.norm.interval(0.99, loc=xbar, scale=s)
(0.21972950119418946, 0.5802704988058106)
(0.40 - 2.576 * np.sqrt(0.40*0.60/50), 0.40 + 2.576 * np.sqrt(0.40*0.60/50))
(0.2215294847881029, 0.5784705152118972)