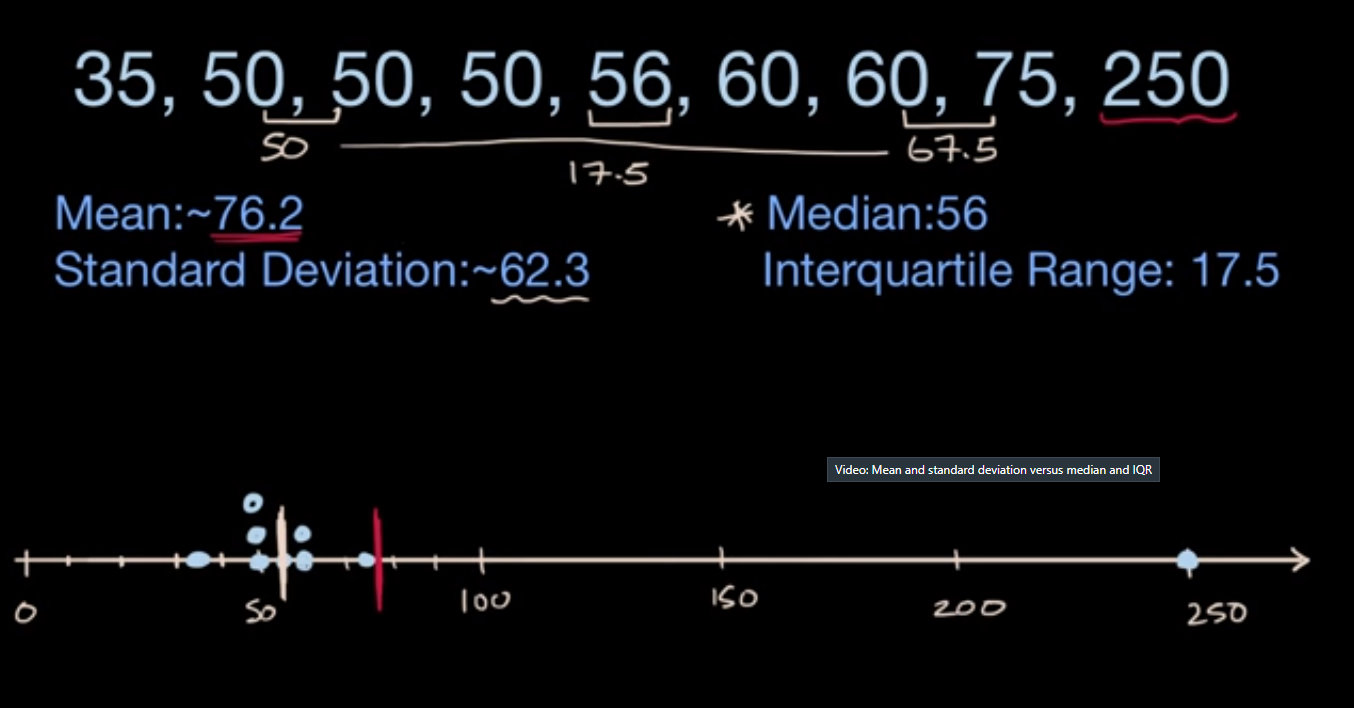
12 Mean and standard deviation versus median and IQR
12 Mean and standard deviation versus median and IQR#
%%html
<iframe width="700" height="400" src="https://www.youtube.com/embed/qNKOi08NxHs/" frameborder="0" allowfullscreen></iframe>
import numpy as np
import pandas as pd
from pandas import Series, DataFrame
import matplotlib.pyplot as plt
from scipy import stats

x = np.array([35, 50, 50, 50, 56, 60, 60, 75, 250])
print(f'Center Tendency: mean {np.mean(x)} \t\t\t median {np.median(x)}')
print(f'Spread: Standard Deviation {np.std(x, ddof=1)} \t\t\t Interquartile Range {stats.iqr(x)}')
Center Tendency: mean 76.22222222222223 			 median 56.0
Spread: Standard Deviation 66.04691093794202 			 Interquartile Range 10.0
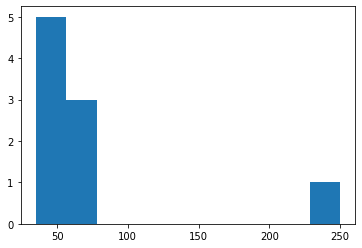
plt.hist(x)
(array([5., 3., 0., 0., 0., 0., 0., 0., 0., 1.]),
 array([ 35. ,  56.5,  78. ,  99.5, 121. , 142.5, 164. , 185.5, 207. ,
        228.5, 250. ]),
 <BarContainer object of 10 artists>)

Ref: stackoverflow
# TODO: Dot Plot instead of Histogram
# TODO: IQR doesn't seem to be accurate

