07 Margin of error 2
07 Margin of error 2#
%%html
<iframe width="700" height="400" src="https://www.youtube.com/embed/YclQE2XtaLw/" frameborder="0" allowfullscreen></iframe>
import numpy as np
import pandas as pd
from pandas import Series, DataFrame
import matplotlib.pyplot as plt
import seaborn as sns
from scipy import stats, special
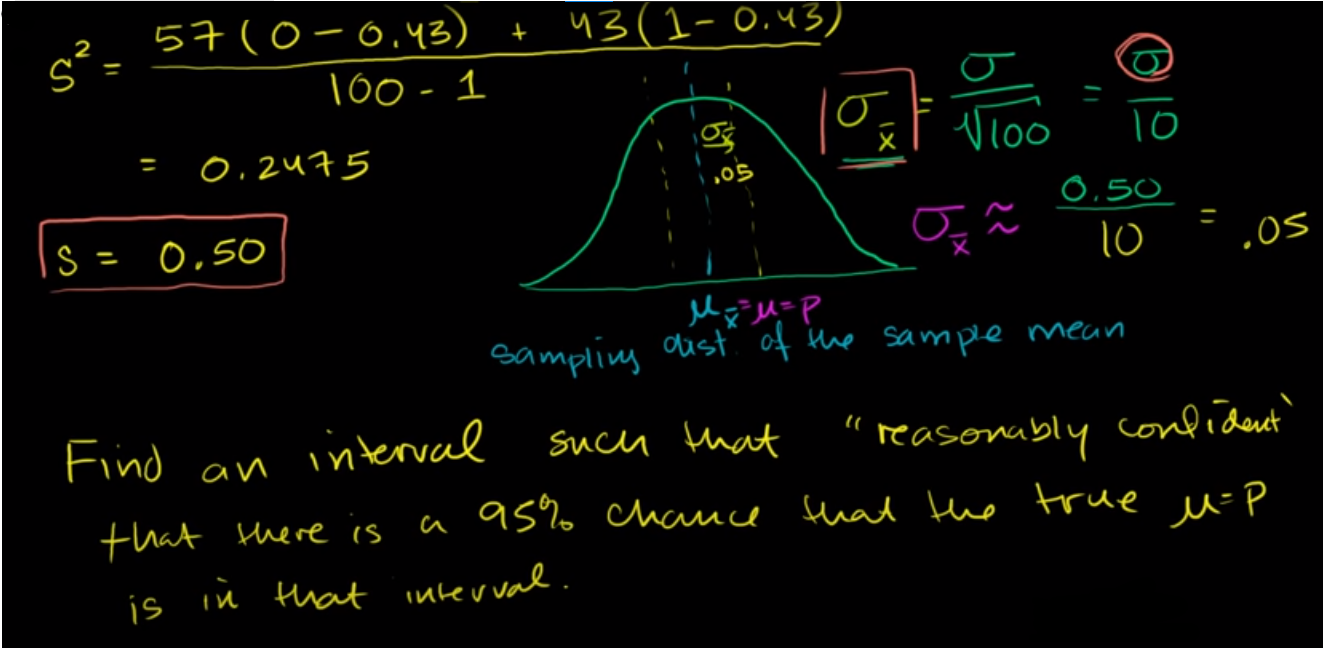
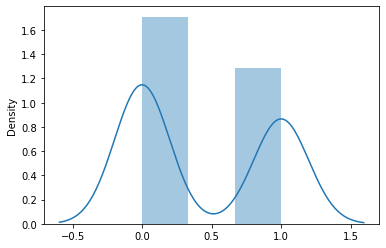
x = np.array(57 * [0] + 43 * [1])
sns.distplot(x)
/opt/hostedtoolcache/Python/3.9.13/x64/lib/python3.9/site-packages/seaborn/distributions.py:2619: FutureWarning: `distplot` is a deprecated function and will be removed in a future version. Please adapt your code to use either `displot` (a figure-level function with similar flexibility) or `histplot` (an axes-level function for histograms).
  warnings.warn(msg, FutureWarning)
<AxesSubplot:ylabel='Density'>
xbar = x.mean()
s = x.std(ddof=1)
mu_xbar = xbar
sigma_xbar = s/np.sqrt(len(x))
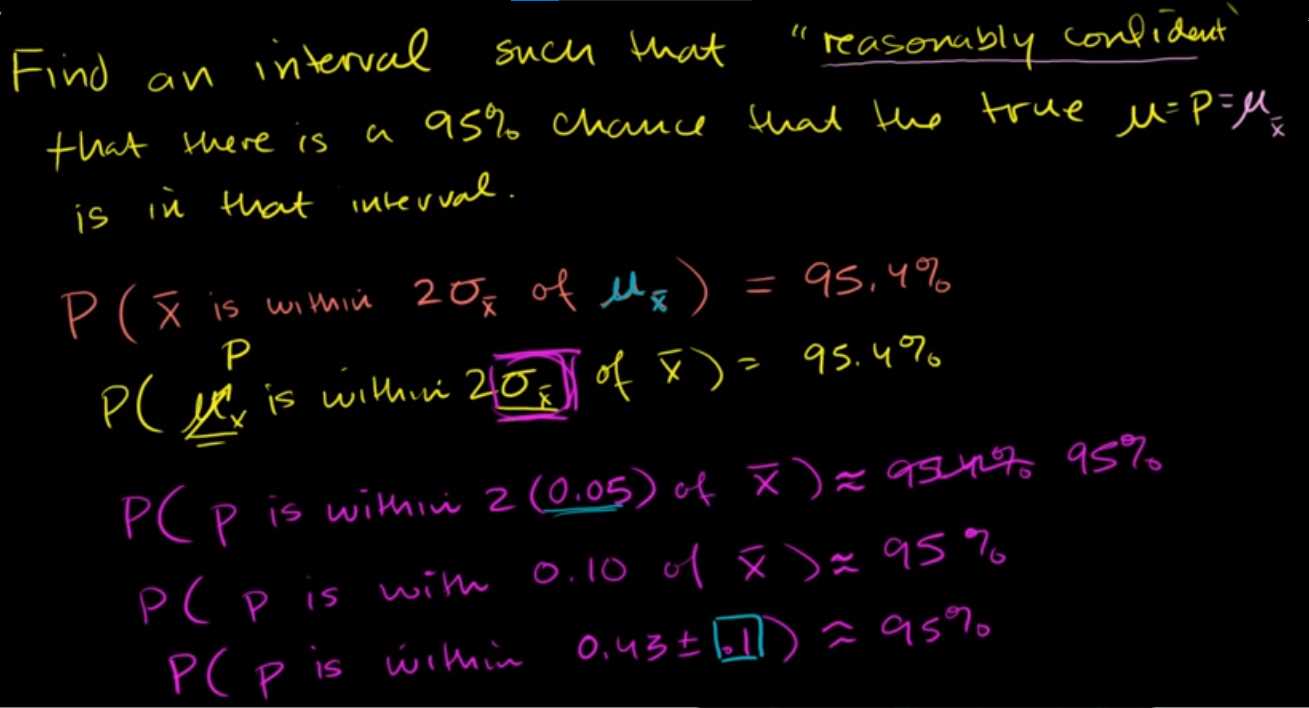
stats.norm.interval(0.95, loc=mu_xbar, scale=sigma_xbar)
(0.3324781010372837, 0.5275218989627163)
(mu_xbar - 2 * sigma_xbar, mu_xbar + 2 * sigma_xbar)
(0.3304860296087514, 0.5295139703912486)