03 Interpreting a histogram
Contents
03 Interpreting a histogram#
import matplotlib.pyplot as plt
import numpy as np
import pandas as pd
import plotly.graph_objects as go
import seaborn as sns
import findspark

findspark.init()
from pyspark.context import SparkContext
from pyspark.sql import functions as F
from pyspark.sql.session import SparkSession

spark = SparkSession.builder.appName("statistics").master("local").getOrCreate()
WARNING: An illegal reflective access operation has occurred
WARNING: Illegal reflective access by org.apache.spark.unsafe.Platform (file:/home/runner/work/statistics/spark-3.1.3-bin-hadoop3.2/jars/spark-unsafe_2.12-3.1.3.jar) to constructor java.nio.DirectByteBuffer(long,int)
WARNING: Please consider reporting this to the maintainers of org.apache.spark.unsafe.Platform
WARNING: Use --illegal-access=warn to enable warnings of further illegal reflective access operations
WARNING: All illegal access operations will be denied in a future release
22/07/21 02:34:02 WARN NativeCodeLoader: Unable to load native-hadoop library for your platform... using builtin-java classes where applicable
Using Spark's default log4j profile: org/apache/spark/log4j-defaults.properties
Setting default log level to "WARN".
To adjust logging level use sc.setLogLevel(newLevel). For SparkR, use setLogLevel(newLevel).
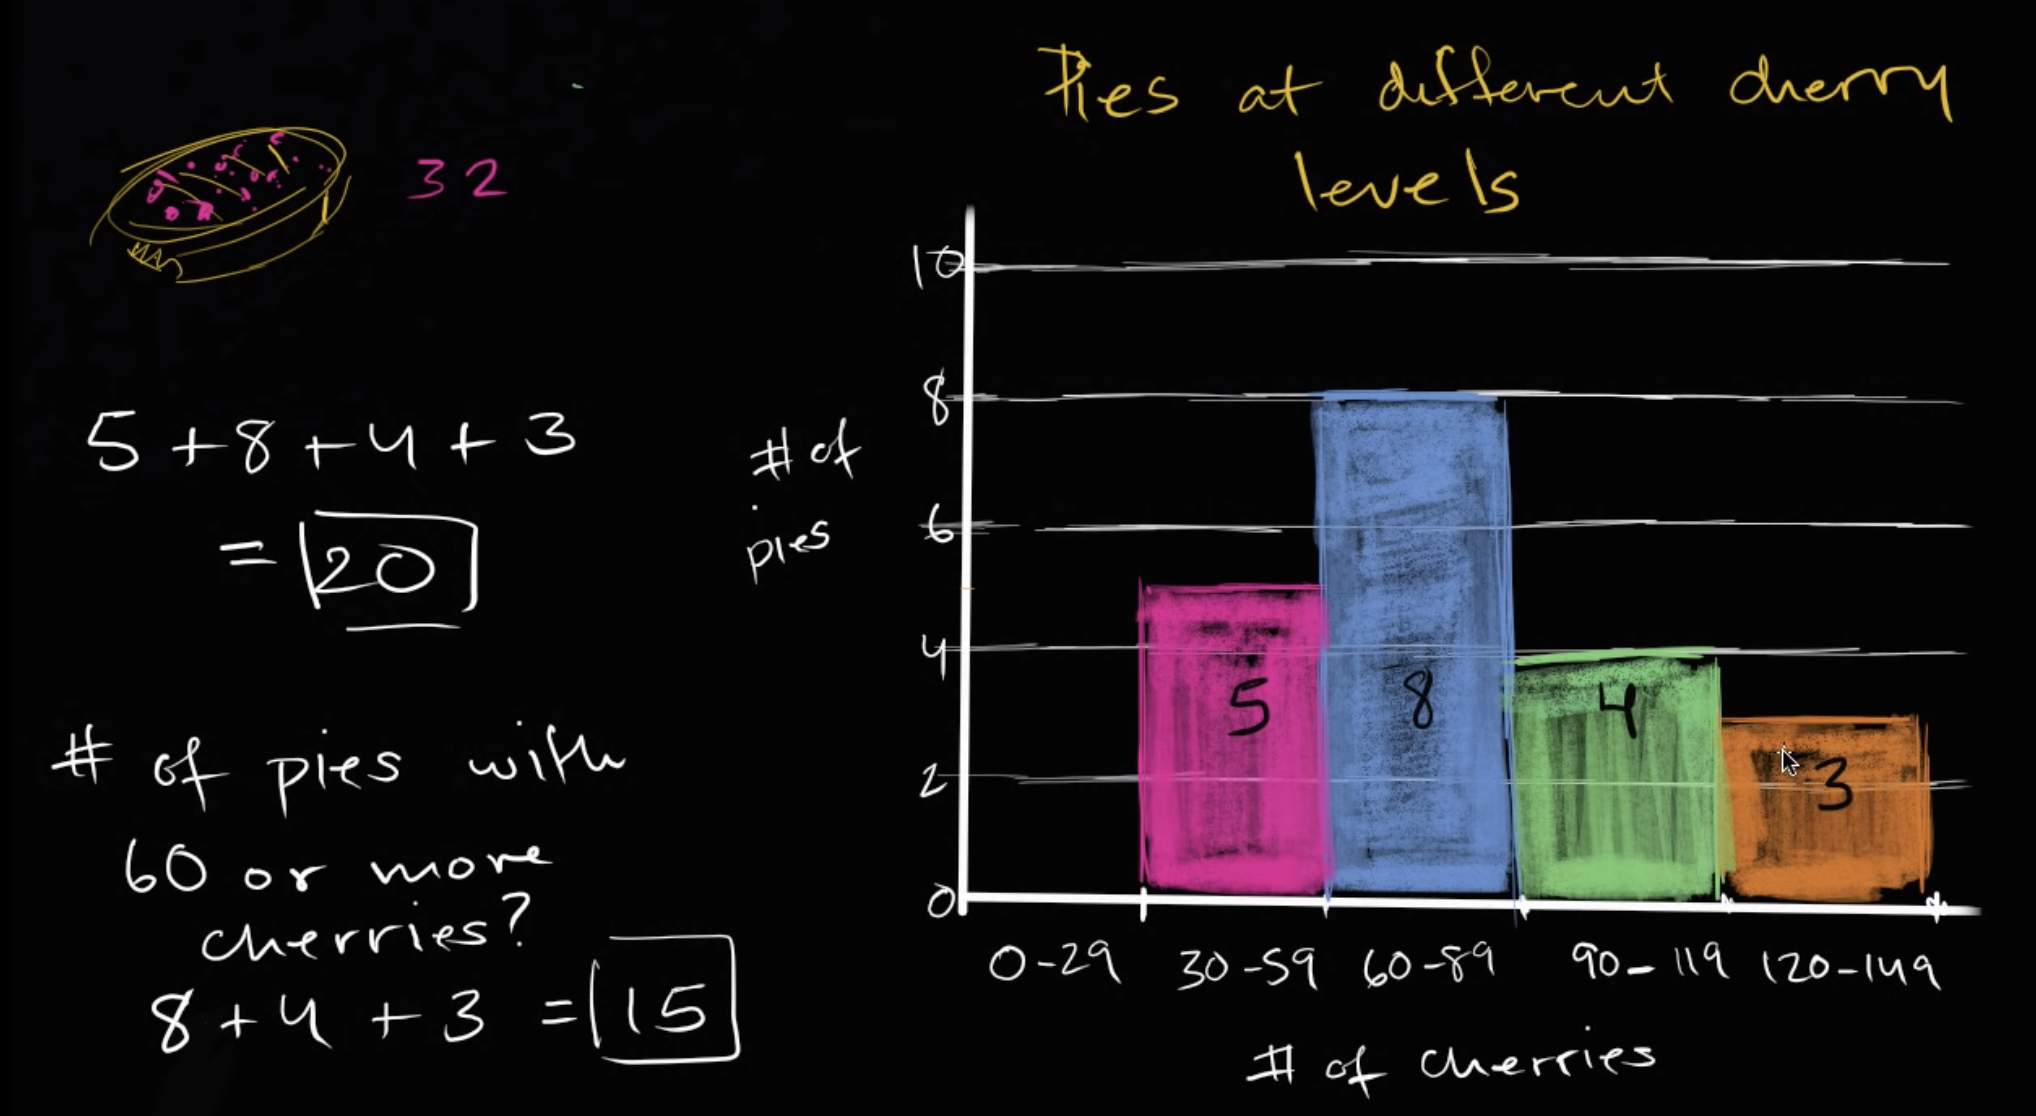
pies = 5 * [60] + 8 * [90] + 4 * [120] + 3 * [150]
bins = np.arange(0, 190, 30)
pies_num, cherries_num = np.histogram(pies, bins)
Histogram#
Matplotlib#
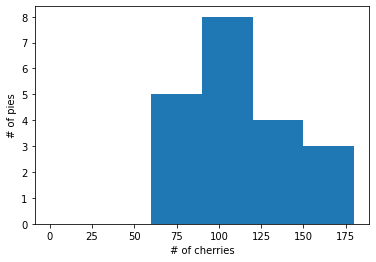
plt.hist(pies, bins=cherries_num)
plt.xlabel("# of cherries")
plt.ylabel("# of pies")
plt.show()
Seaborn#
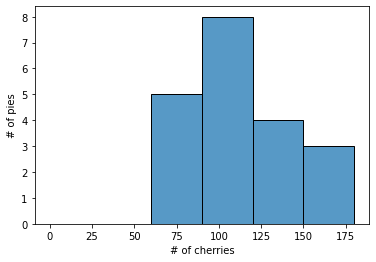
sns.histplot(pies, bins=cherries_num)
plt.yticks = np.arange(0, 12, 2)
plt.xlabel("# of cherries")
plt.ylabel("# of pies")
plt.show()
data = [
    go.Histogram(
        x=pies,
        nbinsx=6,
        marker=dict(color=["magenta", "cornflowerblue", "red", "lightgreen", "yellow"]),
    )
]
layout = go.Layout(xaxis=dict(title="# of cherries"), yaxis=dict(title="# of pies"))
fig = go.Figure(data, layout)
fig.show()