01 Constructing a scatter plot
01 Constructing a scatter plot#
%%html
<iframe width="700" height="400" src="https://www.youtube.com/embed/sHbX58y5D4U/" frameborder="0" allowfullscreen></iframe>
import numpy as np
import pandas as pd
from pandas import Series, DataFrame
import matplotlib.pyplot as plt
import seaborn as sns
from scipy import stats
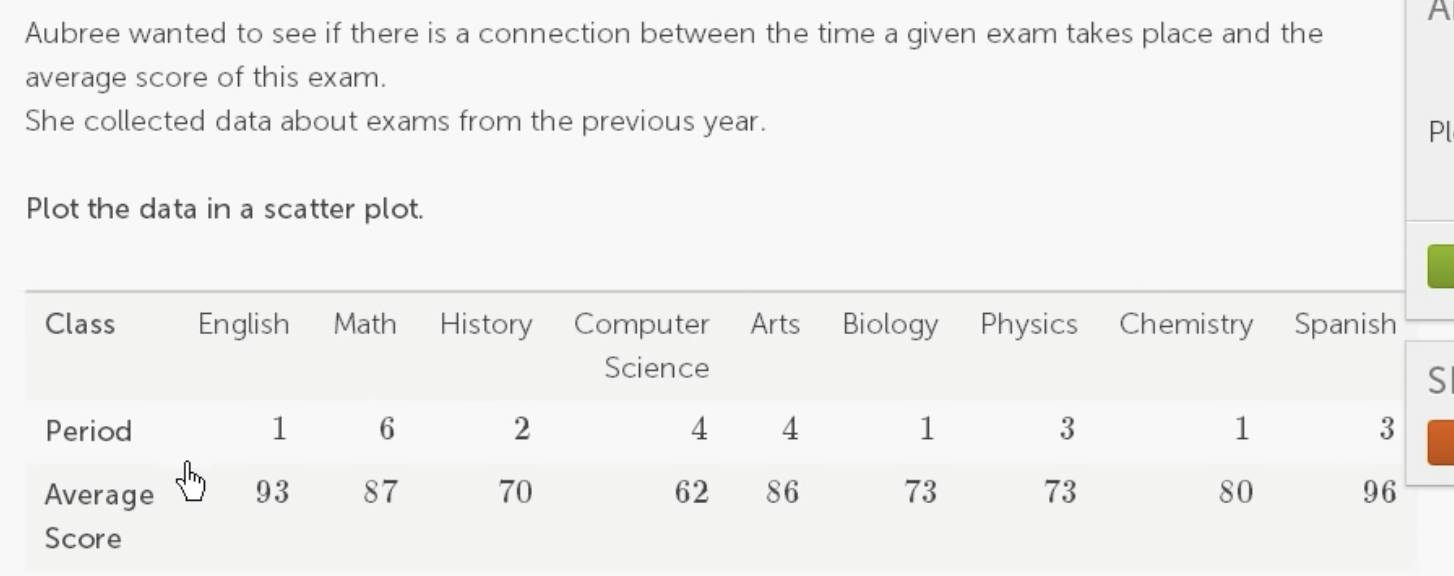
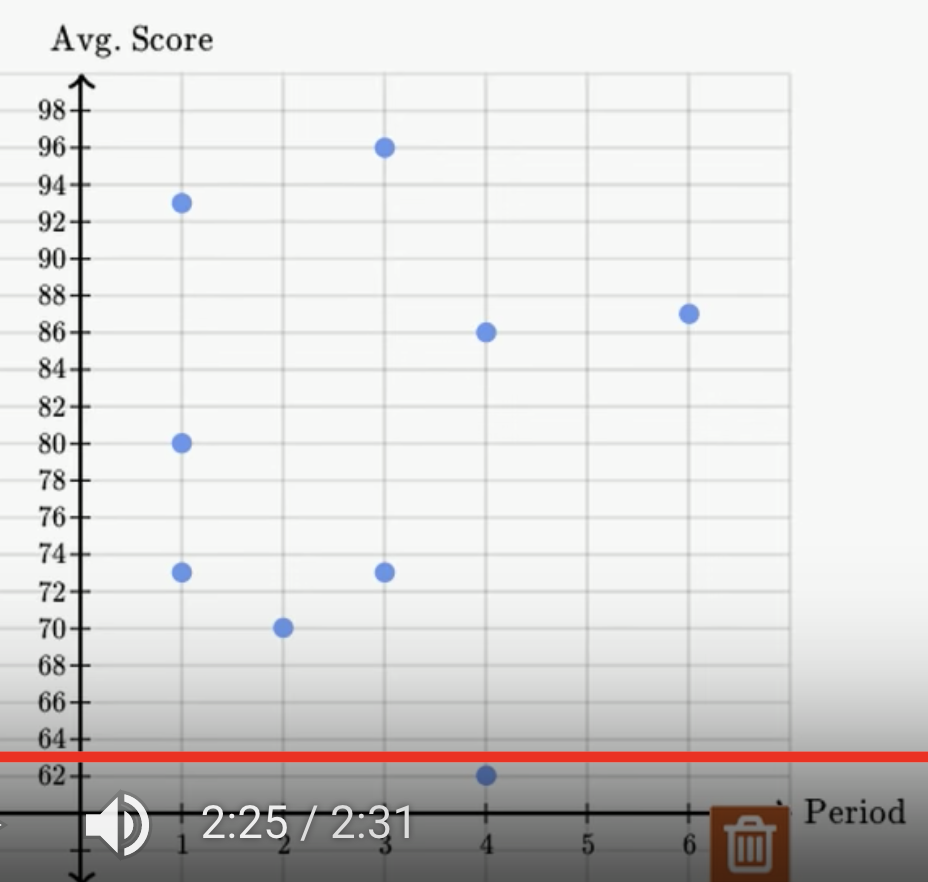
data = {
    'Class': ['English', 'Math', 'History', 'CS', 'Arts', 'Biology', 'Physics', 'Chemistry', 'Spanish'],
    'Period': [1,6,2,4,4,1,3,1,3],
    'Score': [93,87,70,62,86,73,73,80,96]
    }
df = DataFrame(data).set_index('Class')
df
| Period | Score | |
|---|---|---|
| Class | ||
| English | 1 | 93 |
| Math | 6 | 87 |
| History | 2 | 70 |
| CS | 4 | 62 |
| Arts | 4 | 86 |
| Biology | 1 | 73 |
| Physics | 3 | 73 |
| Chemistry | 1 | 80 |
| Spanish | 3 | 96 |
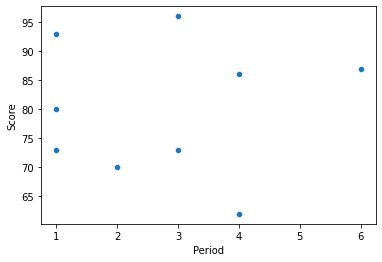
df.plot(kind='scatter', x='Period', y='Score')
<AxesSubplot:xlabel='Period', ylabel='Score'>

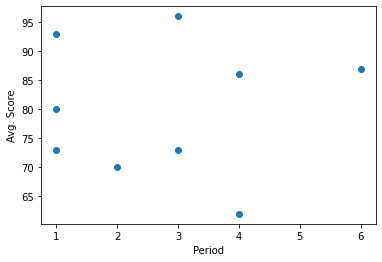
plt.scatter(df['Period'], df['Score'])
plt.xlabel('Period')
plt.ylabel('Avg. Score')
plt.show()
sns.scatterplot(df['Period'], df['Score'])
/opt/hostedtoolcache/Python/3.9.13/x64/lib/python3.9/site-packages/seaborn/_decorators.py:36: FutureWarning: Pass the following variables as keyword args: x, y. From version 0.12, the only valid positional argument will be `data`, and passing other arguments without an explicit keyword will result in an error or misinterpretation.
  warnings.warn(
<AxesSubplot:xlabel='Period', ylabel='Score'>