01 Frequency tables & dot plots
Contents
01 Frequency tables & dot plots#
import matplotlib.pyplot as plt
import numpy as np
import pandas as pd
import plotly.graph_objects as go
import seaborn as sns
from statsmodels.graphics.dotplots import dot_plot
import findspark

findspark.init()
from pyspark.context import SparkContext
from pyspark.sql import functions as F
from pyspark.sql.session import SparkSession

spark = SparkSession.builder.appName("statistics").master("local").getOrCreate()
WARNING: An illegal reflective access operation has occurred
WARNING: Illegal reflective access by org.apache.spark.unsafe.Platform (file:/home/runner/work/statistics/spark-3.1.3-bin-hadoop3.2/jars/spark-unsafe_2.12-3.1.3.jar) to constructor java.nio.DirectByteBuffer(long,int)
WARNING: Please consider reporting this to the maintainers of org.apache.spark.unsafe.Platform
WARNING: Use --illegal-access=warn to enable warnings of further illegal reflective access operations
WARNING: All illegal access operations will be denied in a future release
22/07/21 02:33:30 WARN NativeCodeLoader: Unable to load native-hadoop library for your platform... using builtin-java classes where applicable
Using Spark's default log4j profile: org/apache/spark/log4j-defaults.properties
Setting default log level to "WARN".
To adjust logging level use sc.setLogLevel(newLevel). For SparkR, use setLogLevel(newLevel).
dataset = {"Age": [5, 7, 5, 9, 7, 7, 6, 9, 9, 9, 10, 12, 12, 7]}
DataFrame#
pandas#
df = pd.DataFrame(dataset)
df
| Age | |
|---|---|
| 0 | 5 |
| 1 | 7 |
| 2 | 5 |
| 3 | 9 |
| 4 | 7 |
| 5 | 7 |
| 6 | 6 |
| 7 | 9 |
| 8 | 9 |
| 9 | 9 |
| 10 | 10 |
| 11 | 12 |
| 12 | 12 |
| 13 | 7 |
Spark#
sdf = spark.createDataFrame(zip(*dataset.values()), schema=list(dataset.keys()))
sdf.show()
[Stage 0:> (0 + 1) / 1]
+---+
|Age|
+---+
|  5|
|  7|
|  5|
|  9|
|  7|
|  7|
|  6|
|  9|
|  9|
|  9|
| 10|
| 12|
| 12|
|  7|
+---+
df = pd.DataFrame(dataset)
df
| Age | |
|---|---|
| 0 | 5 |
| 1 | 7 |
| 2 | 5 |
| 3 | 9 |
| 4 | 7 |
| 5 | 7 |
| 6 | 6 |
| 7 | 9 |
| 8 | 9 |
| 9 | 9 |
| 10 | 10 |
| 11 | 12 |
| 12 | 12 |
| 13 | 7 |
Range#
Pandas#
df['Age'].max() - df['Age'].min()
7
Spark#
sdf.select("Age").rdd.max()[0] - sdf.select("Age").rdd.min()[0]
7
Frequency table#
Pandas#
freq_table_series = df["Age"].value_counts()
freq_table_data = {
    "Age": freq_table_series.index,
    "# at age": freq_table_series.values.tolist(),
}
freq_table_df = pd.DataFrame(freq_table_data)
freq_table_df
| Age | # at age | |
|---|---|---|
| 0 | 7 | 4 |
| 1 | 9 | 4 |
| 2 | 5 | 2 |
| 3 | 12 | 2 |
| 4 | 6 | 1 |
| 5 | 10 | 1 |
Spark#
freq_table_sdf = spark.createDataFrame(
    zip(*freq_table_data.values()), schema=list(freq_table_data.keys())
)
freq_table_sdf.show()
+---+--------+
|Age|# at age|
+---+--------+
|  7|       4|
|  9|       4|
|  5|       2|
| 12|       2|
|  6|       1|
| 10|       1|
+---+--------+
How many older than 9#
Pandas#
freq_table_df[freq_table_df["Age"] > 9]
| Age | # at age | |
|---|---|---|
| 3 | 12 | 2 |
| 5 | 10 | 1 |
Spark#
freq_table_sdf[freq_table_sdf["Age"] > 9].show()
+---+--------+
|Age|# at age|
+---+--------+
| 12|       2|
| 10|       1|
+---+--------+
Plot#
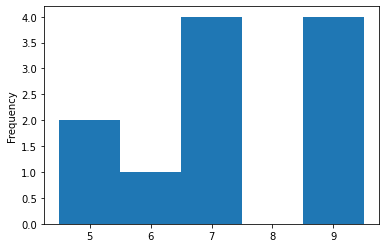
Pandas#
df["Age"].plot(kind="hist", bins=np.array([4, 5, 6, 7, 8, 9]) + 0.5)
<AxesSubplot:ylabel='Frequency'>
Matplotlib#
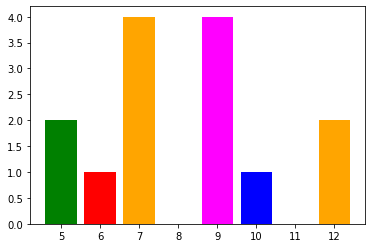
plt.bar(
    x=freq_table_df["Age"],
    height=freq_table_df["# at age"],
    color=["orange", "magenta", "green", "orange", "red", "blue", "brown"],
)
plt.show()
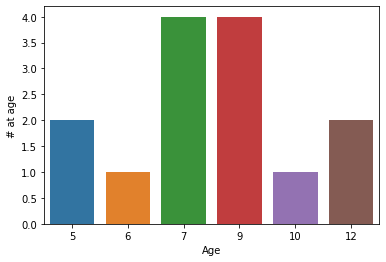
Seaborn#
sns.barplot(x=freq_table_df["Age"], y=freq_table_df["# at age"])
plt.show()
Plotly#
data = [
    go.Bar(
        x=freq_table_df["Age"],
        y=freq_table_df["# at age"],
        marker=dict(color=["orange", "magenta", "green", "orange", "red", "blue"]),
    )
]
fig = go.Figure(data=data)
fig.show()
Statsmodels#
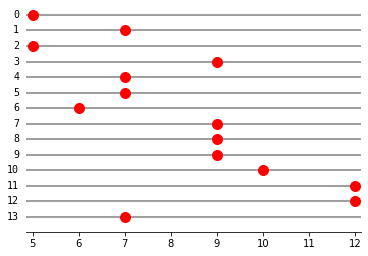
dot_plot(df["Age"])
plt.show()