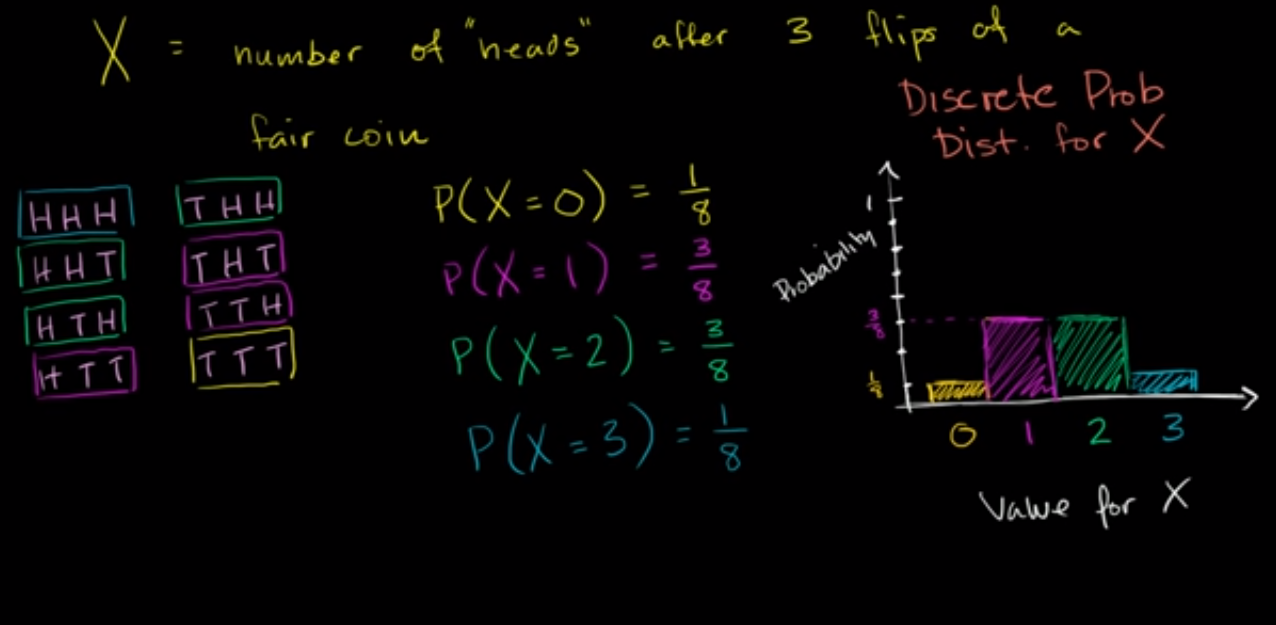
01 Constructing a probability distribution for random variable
01 Constructing a probability distribution for random variable#
%%html
<iframe width="700" height="400" src="https://www.youtube.com/embed/cqK3uRoPtk0/" frameborder="0" allowfullscreen></iframe>
import numpy as np
import pandas as pd
from pandas import Series, DataFrame
import matplotlib.pyplot as plt
import seaborn as sns
import itertools

flips = ["".join(i) for i in itertools.product(['H', 'T'], repeat=3)]
flips
['HHH', 'HHT', 'HTH', 'HTT', 'THH', 'THT', 'TTH', 'TTT']
def P(cond, total_lst):
    cond_lst = list(filter(cond, total_lst))
    return len(cond_lst) / len(total_lst), cond_lst
def P_in_a_row(p, n):
    return p**n
# P(x=0) = P(TTT)
p_x_0 =  P(lambda x: 'H' not in x, flips)[0]
p_x_0
0.125
# P(x=1)
p_x_1 = P(lambda x: len(x.replace('T', '')) == 1, flips)[0]
p_x_1
0.375
# P(x=2)
p_x_2 = P(lambda x: len(x.replace('T', '')) == 2, flips)[0]
p_x_2
0.375
# P(x=3)
p_x_3 = P(lambda x: len(x.replace('T', '')) == 3, flips)[0]
p_x_3
0.125
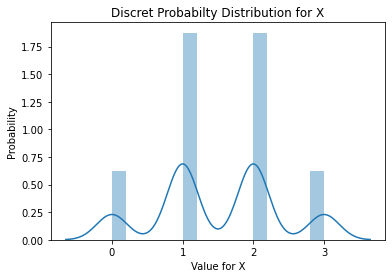
dist = []
for idx , i in enumerate(map(lambda x: x*1000, [p_x_0, p_x_1, p_x_2, p_x_3])):
    dist.extend(int(i) * [idx])
sns.distplot(dist)
plt.title('Discret Probabilty Distribution for X')
plt.xlabel('Value for X')
plt.ylabel('Probability')
/opt/hostedtoolcache/Python/3.9.13/x64/lib/python3.9/site-packages/seaborn/distributions.py:2619: FutureWarning: `distplot` is a deprecated function and will be removed in a future version. Please adapt your code to use either `displot` (a figure-level function with similar flexibility) or `histplot` (an axes-level function for histograms).
  warnings.warn(msg, FutureWarning)
Text(0, 0.5, 'Probability')

# another way to think about it
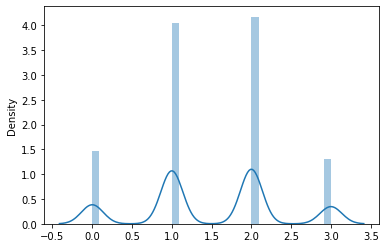
sns.distplot(np.random.choice([0, 1, 2, 3], p=[p_x_0, p_x_1, p_x_2, p_x_3], size=10000))
/opt/hostedtoolcache/Python/3.9.13/x64/lib/python3.9/site-packages/seaborn/distributions.py:2619: FutureWarning: `distplot` is a deprecated function and will be removed in a future version. Please adapt your code to use either `displot` (a figure-level function with similar flexibility) or `histplot` (an axes-level function for histograms).
  warnings.warn(msg, FutureWarning)
<AxesSubplot:ylabel='Density'>

# find a better way than multiplying in 1000

