06 Two-way (column or row) relative frequency tables
06 Two-way (column or row) relative frequency tables#
%%html
<iframe width="700" height="400" src="https://www.youtube.com/embed/_ETPMszULXc/" frameborder="0" allowfullscreen></iframe>
import matplotlib.pyplot as plt
import numpy as np
import pandas as pd
import plotly.graph_objects as go
import seaborn as sns
import findspark

findspark.init()
from pyspark.context import SparkContext
from pyspark.sql import functions as F
from pyspark.sql.session import SparkSession

spark = SparkSession.builder.appName("statistics").master("local").getOrCreate()
WARNING: An illegal reflective access operation has occurred
WARNING: Illegal reflective access by org.apache.spark.unsafe.Platform (file:/home/runner/work/statistics/spark-3.1.3-bin-hadoop3.2/jars/spark-unsafe_2.12-3.1.3.jar) to constructor java.nio.DirectByteBuffer(long,int)
WARNING: Please consider reporting this to the maintainers of org.apache.spark.unsafe.Platform
WARNING: Use --illegal-access=warn to enable warnings of further illegal reflective access operations
WARNING: All illegal access operations will be denied in a future release
22/07/21 02:32:02 WARN NativeCodeLoader: Unable to load native-hadoop library for your platform... using builtin-java classes where applicable
Using Spark's default log4j profile: org/apache/spark/log4j-defaults.properties
Setting default log level to "WARN".
To adjust logging level use sc.setLogLevel(newLevel). For SparkR, use setLogLevel(newLevel).
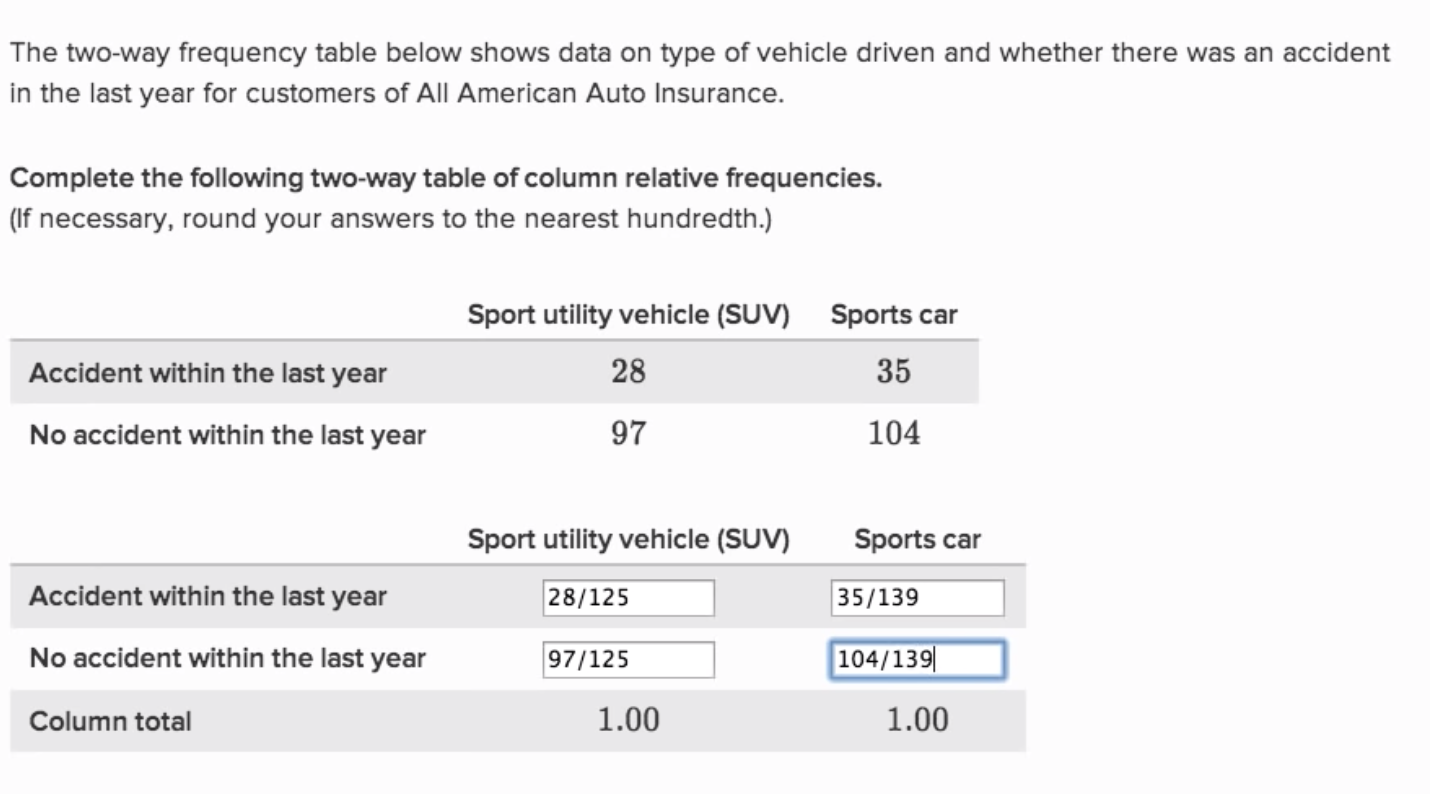
dataset = {
    "Car": 28 * ["SUV"] + 35 * ["Sport car"] + 97 * ["SUV"] + 104 * ["Sport car"],
    "Accident": 28 * ["yes"] + 35 * ["yes"] + 97 * ["no"] + 104 * ["no"],
}
df = pd.DataFrame(dataset)
df
| Car | Accident | |
|---|---|---|
| 0 | SUV | yes |
| 1 | SUV | yes |
| 2 | SUV | yes |
| 3 | SUV | yes |
| 4 | SUV | yes |
| ... | ... | ... |
| 259 | Sport car | no |
| 260 | Sport car | no |
| 261 | Sport car | no |
| 262 | Sport car | no |
| 263 | Sport car | no |
264 rows × 2 columns
sdf = spark.createDataFrame(zip(*dataset.values()), schema=list(dataset.keys()))
sdf.registerTempTable("sdf_table")
sdf.show()
[Stage 0:> (0 + 1) / 1]
+---+--------+
|Car|Accident|
+---+--------+
|SUV|     yes|
|SUV|     yes|
|SUV|     yes|
|SUV|     yes|
|SUV|     yes|
|SUV|     yes|
|SUV|     yes|
|SUV|     yes|
|SUV|     yes|
|SUV|     yes|
|SUV|     yes|
|SUV|     yes|
|SUV|     yes|
|SUV|     yes|
|SUV|     yes|
|SUV|     yes|
|SUV|     yes|
|SUV|     yes|
|SUV|     yes|
|SUV|     yes|
+---+--------+
only showing top 20 rows
df.groupby(["Accident", "Car"]).size()
Accident  Car
no        SUV           97
          Sport car    104
yes       SUV           28
          Sport car     35
dtype: int64
sdf.groupby("Accident", "Car").count().show()
[Stage 8:======================>                                 (41 + 1) / 100]

[Stage 8:=================================>                      (59 + 1) / 100]
[Stage 8:=============================================> (81 + 1) / 100]
+--------+---------+-----+
|Accident|      Car|count|
+--------+---------+-----+
|      no|      SUV|   97|
|     yes|Sport car|   35|
|      no|Sport car|  104|
|     yes|      SUV|   28|
+--------+---------+-----+
spark.sql(
    "select Accident, Car, count(*) as count from sdf_table group by Accident, Car"
).show()
[Stage 18:====================================================> (96 + 1) / 100]
+--------+---------+-----+
|Accident|      Car|count|
+--------+---------+-----+
|      no|      SUV|   97|
|     yes|Sport car|   35|
|      no|Sport car|  104|
|     yes|      SUV|   28|
+--------+---------+-----+
two_way_table = pd.crosstab(df["Accident"], df["Car"])
two_way_table
| Car | SUV | Sport car |
|---|---|---|
| Accident | ||
| no | 97 | 104 |
| yes | 28 | 35 |
s_two_way_table = sdf.crosstab("Accident", "Car")
s_two_way_table.show()
+------------+---+---------+
|Accident_Car|SUV|Sport car|
+------------+---+---------+
|         yes| 28|       35|
|          no| 97|      104|
+------------+---+---------+
freq_table = two_way_table.copy()
freq_table["SUV"] = two_way_table["SUV"] / two_way_table["SUV"].sum()
freq_table["Sport car"] = two_way_table["Sport car"] / two_way_table["Sport car"].sum()
freq_table
| Car | SUV | Sport car |
|---|---|---|
| Accident | ||
| no | 0.776 | 0.748201 |
| yes | 0.224 | 0.251799 |
s_freq_table = s_two_way_table
s_freq_table = s_freq_table.withColumn(
    "SUV", F.col("SUV") / s_freq_table.select(F.sum("SUV")).collect()[0][0]
)
s_freq_table = s_freq_table.withColumn(
    "Sport car",
    F.col("Sport car") / s_freq_table.select(F.sum("Sport car")).collect()[0][0],
)
s_freq_table.show()
+------------+-----+------------------+
|Accident_Car|  SUV|         Sport car|
+------------+-----+------------------+
|         yes|0.224|0.2517985611510791|
|          no|0.776|0.7482014388489209|
+------------+-----+------------------+
freq_table = freq_table.append(freq_table.sum().rename("Total"))
freq_table
/tmp/ipykernel_4071/3552347670.py:1: FutureWarning: The frame.append method is deprecated and will be removed from pandas in a future version. Use pandas.concat instead.
  freq_table = freq_table.append(freq_table.sum().rename("Total"))
| Car | SUV | Sport car |
|---|---|---|
| Accident | ||
| no | 0.776 | 0.748201 |
| yes | 0.224 | 0.251799 |
| Total | 1.000 | 1.000000 |