10 Sample standard deviation and bias
10 Sample standard deviation and bias#
%%html
<iframe width="700" height="400" src="https://www.youtube.com/embed/DNAnQBhGpRw/" frameborder="0" allowfullscreen></iframe>
import numpy as np
import pandas as pd
from pandas import Series, DataFrame
import matplotlib.pyplot as plt
from scipy import stats
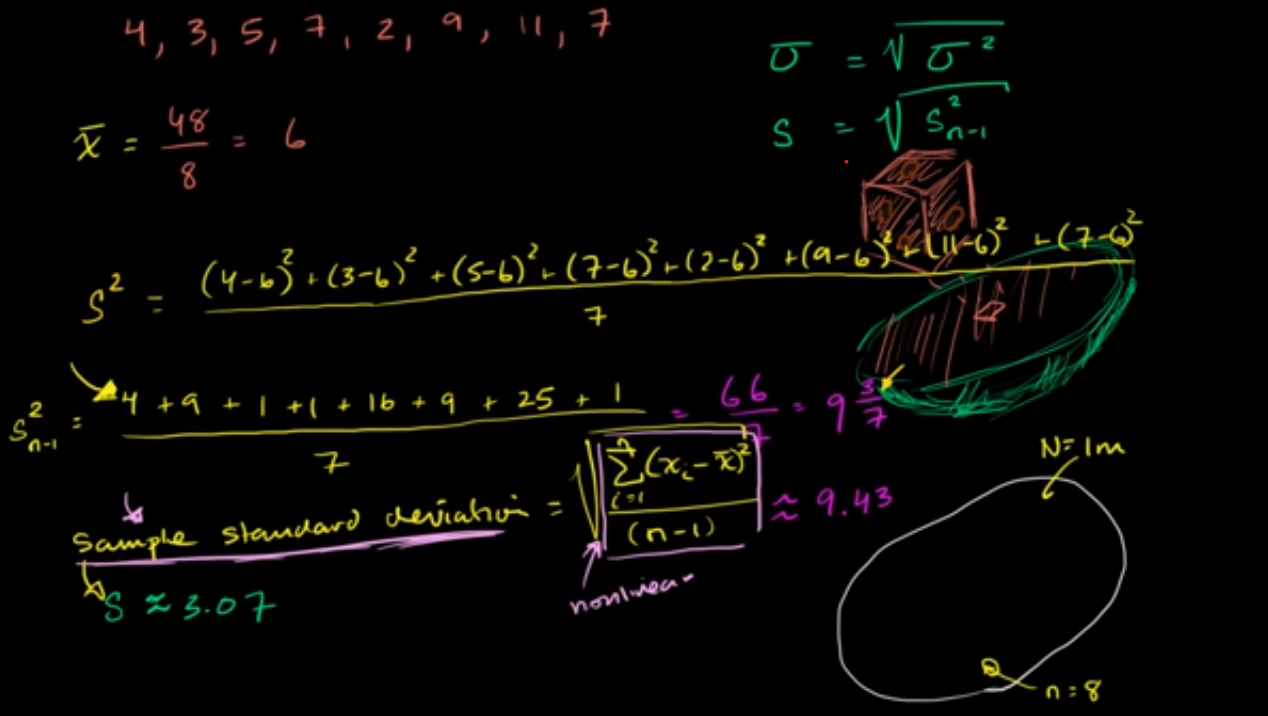
\[ \text{Population Variance } \sigma^2 = \frac{\sum_{i=1}^{N} (x_{i} - \mu)^2}{N} \]
\[ \text{Sample Variance } S^{2} = S_{n-1}^{2} = \frac{ \sum_{i=1}^{n} (x_{i} - \bar{x} ) ^ {2} }{n-1} \]
\[ \text{Population Standard Deviation } \sigma = \sqrt{\sigma} = \sqrt{ \frac{ \sum_{i=1}^{N} (x_{i} - \mu)^{2} }{N} } \]
\[ \text{Sample Standard Deviation } S = \sqrt{S} = \sqrt{\frac{ \sum_{i=1}^{n} (x_{i} - \bar{x}) ^ {2} }{n-1} } \]
x = np.array([4, 3, 5, 7, 2, 9, 11, 7])
n = x.shape[0]
x_bar = x.mean()
np.sqrt(np.sum((x - x_bar)**2)/(n-1))
3.070597894314954
x.std(ddof=1)
3.070597894314954