12 Residual plots
12 Residual plots#
%%html
<iframe width="700" height="400" src="https://www.youtube.com/embed/VamMrPZ-8fc/" frameborder="0" allowfullscreen></iframe>
import numpy as np
import pandas as pd
from pandas import Series, DataFrame
import matplotlib.pyplot as plt
import seaborn as sns
from scipy import stats
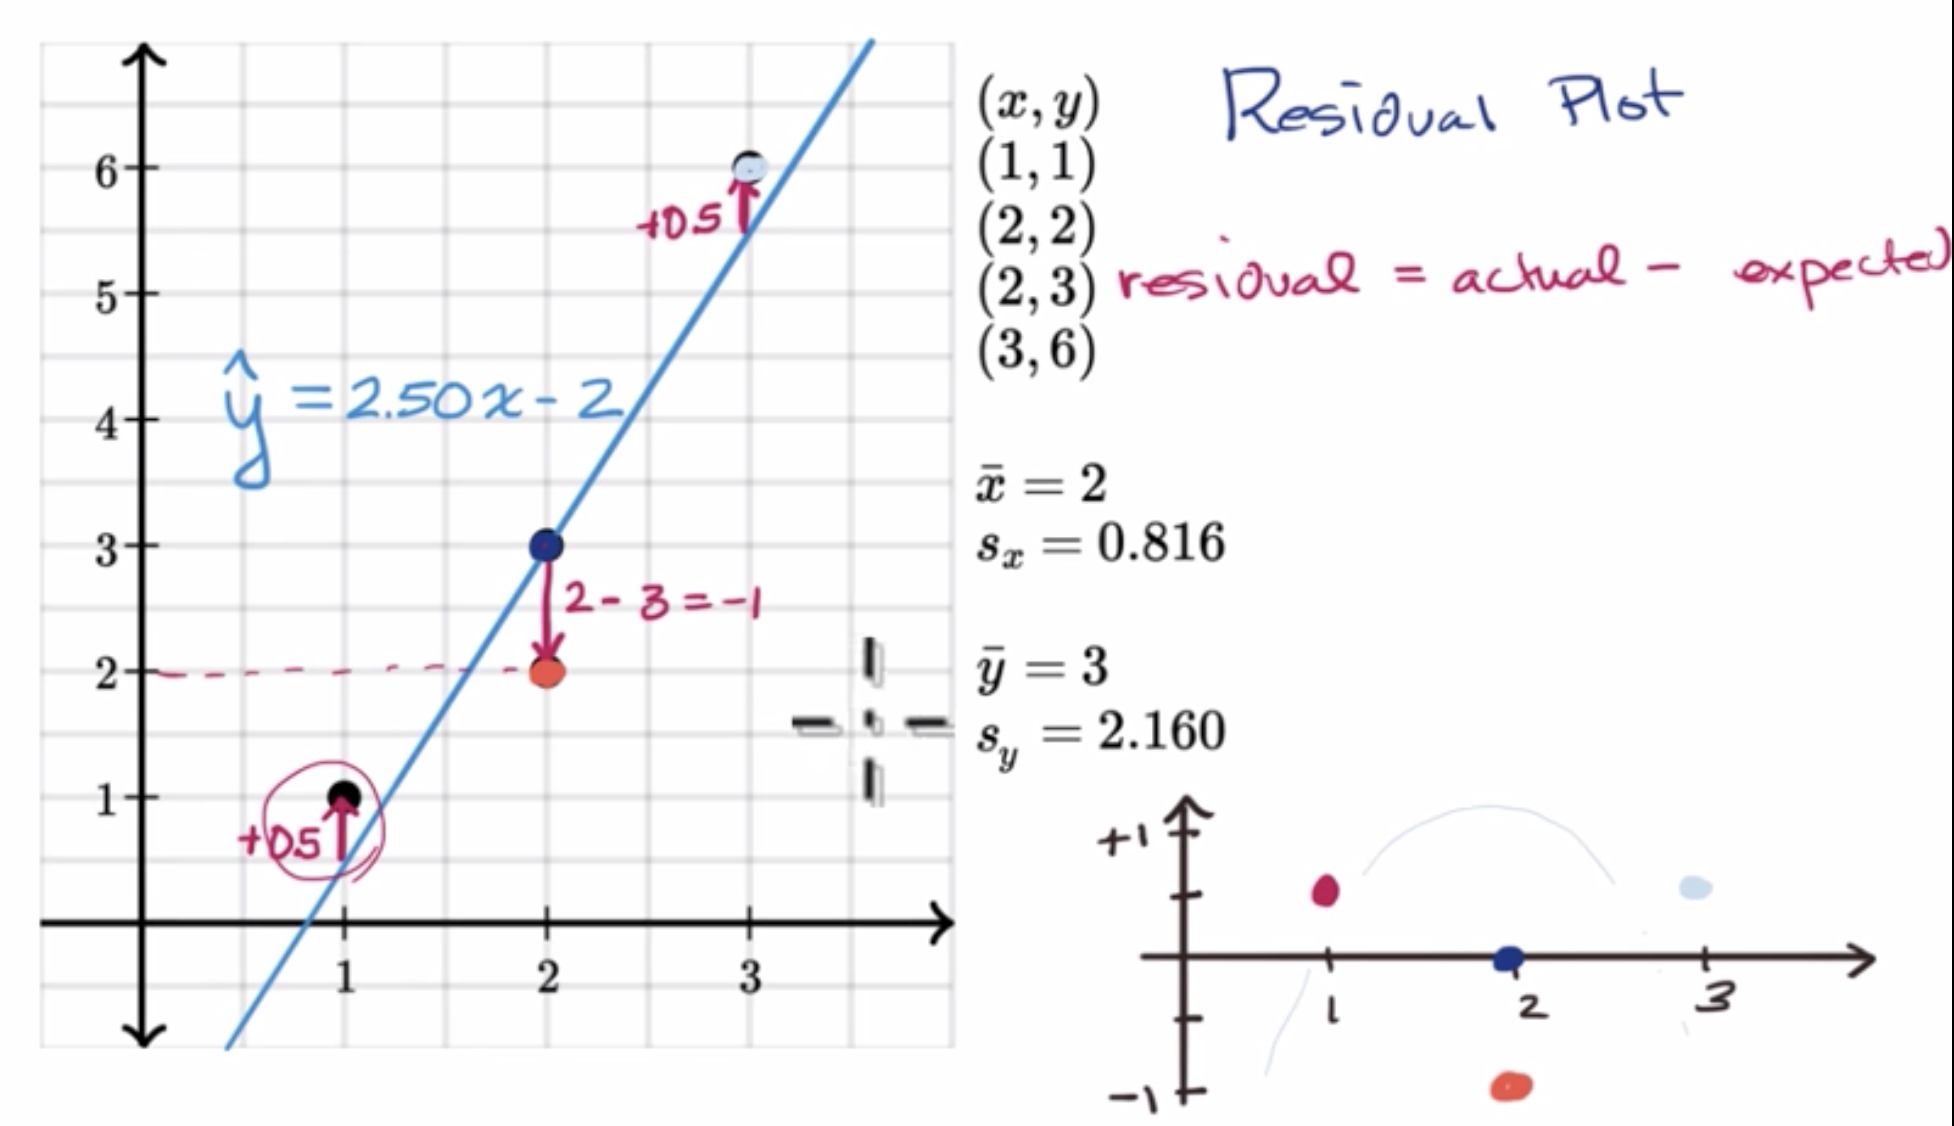
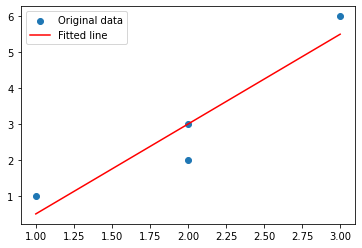
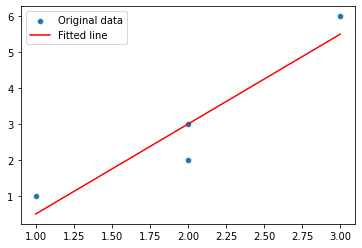
x = np.array([1, 2, 2, 3])
y = np.array([1, 2, 3, 6])
slope, intercept, rvalue, pvalue, stderr = stats.linregress(x, y)
yhat = intercept + slope * x
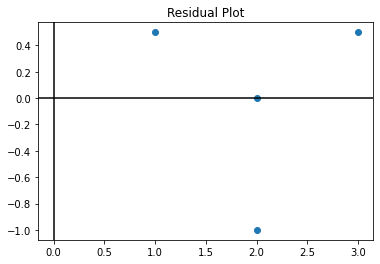
\[ residual = actual - predict \]
\[ residual = y - \hat{y} \]
r = y - yhat
plt.scatter(x, y, label='Original data')
plt.plot(x, yhat, color='r', label='Fitted line')
plt.legend()
plt.show()
sns.scatterplot(x, y, label='Original data')
sns.lineplot(x, yhat, color='r', label='Fitted line')
/opt/hostedtoolcache/Python/3.9.13/x64/lib/python3.9/site-packages/seaborn/_decorators.py:36: FutureWarning: Pass the following variables as keyword args: x, y. From version 0.12, the only valid positional argument will be `data`, and passing other arguments without an explicit keyword will result in an error or misinterpretation.
  warnings.warn(
<AxesSubplot:>
# residual plot
plt.scatter(x, r)
plt.title('Residual Plot')
plt.axhline(y=0, color='k')
plt.axvline(x=0, color='k')
<matplotlib.lines.Line2D at 0x7f6e91c37d60>
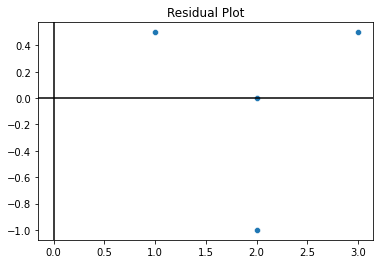
sns.scatterplot(x, r)
plt.title('Residual Plot')
plt.axhline(y=0, color='k')
plt.axvline(x=0, color='k')
/opt/hostedtoolcache/Python/3.9.13/x64/lib/python3.9/site-packages/seaborn/_decorators.py:36: FutureWarning: Pass the following variables as keyword args: x, y. From version 0.12, the only valid positional argument will be `data`, and passing other arguments without an explicit keyword will result in an error or misinterpretation.
  warnings.warn(
<matplotlib.lines.Line2D at 0x7f6e91c98c70>
How do you check the quality of your regression model in Python?