05 Variance and standard deviation of a discrete random variable
05 Variance and standard deviation of a discrete random variable#
%%html
<iframe width="700" height="400" src="https://www.youtube.com/embed/2egl_5c8i-g/" frameborder="0" allowfullscreen></iframe>
import numpy as np
import pandas as pd
from pandas import Series, DataFrame
import matplotlib.pyplot as plt
import seaborn as sns
from scipy import stats, special
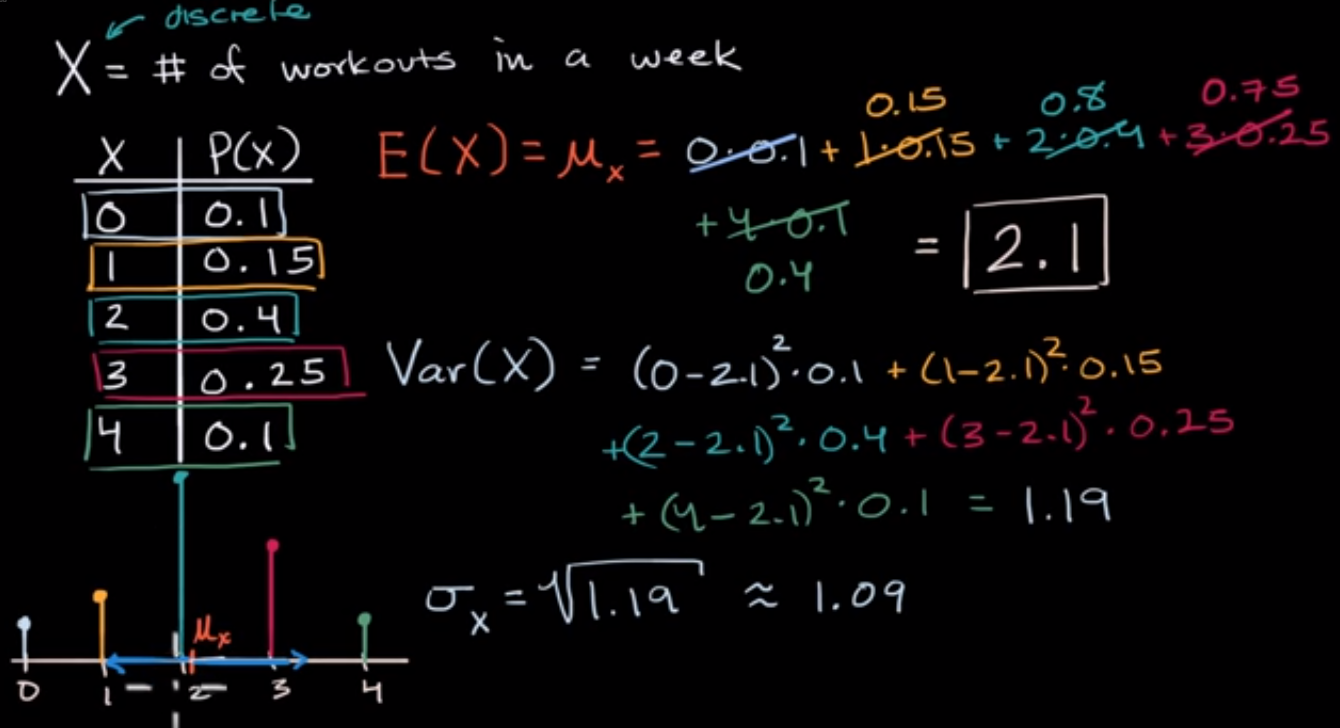
df = DataFrame({'x': [0, 1, 2, 3, 4] ,'P(x)': [0.1, 0.15, 0.4, 0.25, 0.1]})
df
| x | P(x) | |
|---|---|---|
| 0 | 0 | 0.10 |
| 1 | 1 | 0.15 |
| 2 | 2 | 0.40 |
| 3 | 3 | 0.25 |
| 4 | 4 | 0.10 |
mean = np.sum(df['x'] * df['P(x)'])
# caution Linear algebra
mean = np.dot(df['x'], df['P(x)'])
var = np.sum((df['x'] - mean)**2 * df['P(x)'])
std = np.sqrt(var)
mean
2.1
var
1.19
std
1.0908712114635715
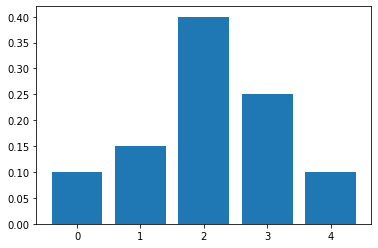
plt.bar(df['x'], df['P(x)'])
<BarContainer object of 5 artists>
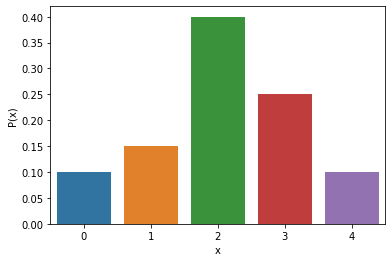
sns.barplot(df['x'], df['P(x)'])
/opt/hostedtoolcache/Python/3.9.13/x64/lib/python3.9/site-packages/seaborn/_decorators.py:36: FutureWarning: Pass the following variables as keyword args: x, y. From version 0.12, the only valid positional argument will be `data`, and passing other arguments without an explicit keyword will result in an error or misinterpretation.
  warnings.warn(
<AxesSubplot:xlabel='x', ylabel='P(x)'>
# scipy.norm.mean; scipy.norm.var; scipy.norm.std but how?