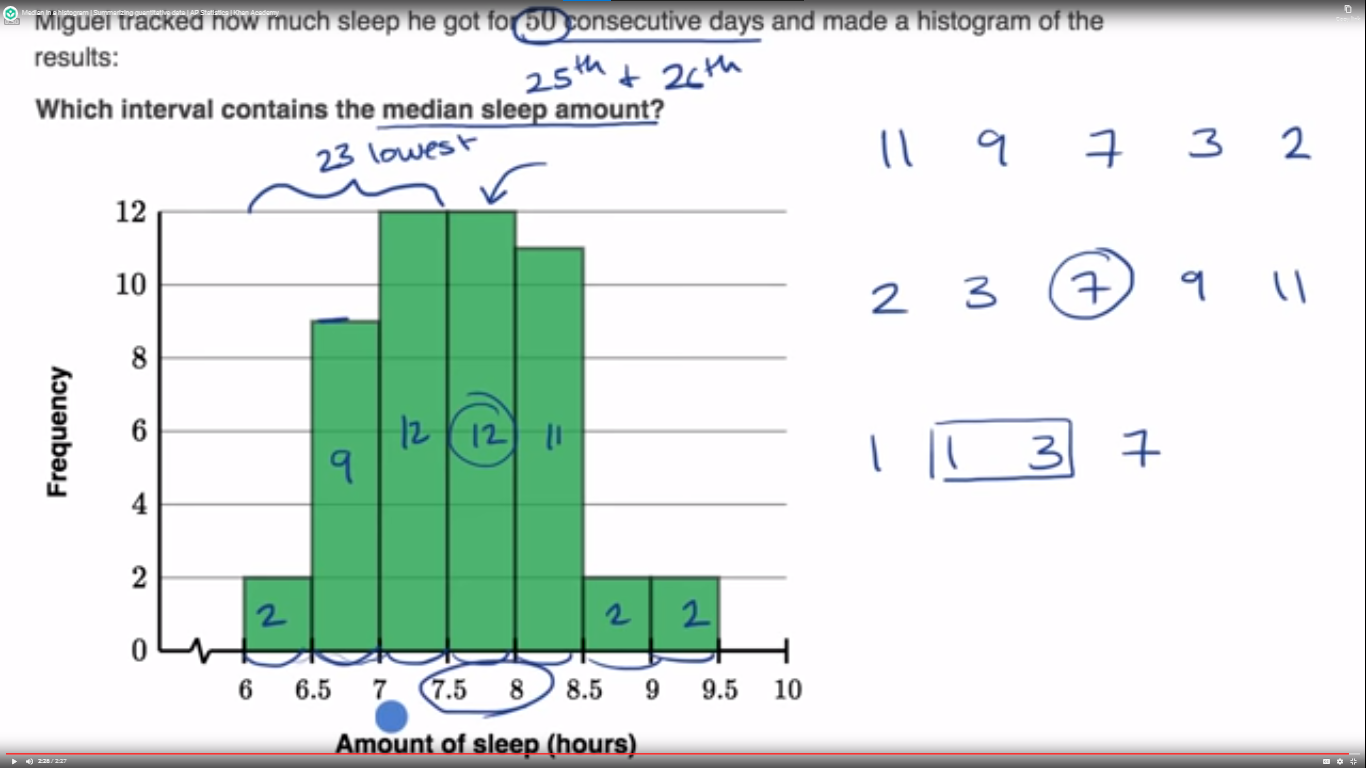
03 Median in a histogram
03 Median in a histogram#
%%html
<iframe width="700" height="400" src="https://www.youtube.com/embed/xTwDmnEEb9E/" frameborder="0" allowfullscreen></iframe>
import numpy as np
import pandas as pd
from pandas import Series, DataFrame
import matplotlib.pyplot as plt
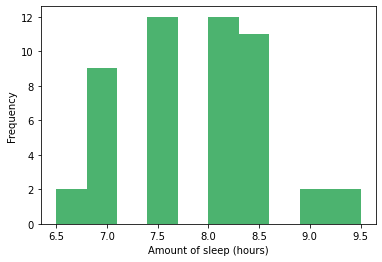
dist = np.array(2 * [6.5] + 9 * [7] + 12 * [7.5] + 12 * [8] + 11 * [8.5] + 2 * [9] + 2 * [9.5])
bins=[0, 6, 6.5, 7, 7.5, 8, 8.5, 9, 9.5, 10]
plt.hist(dist, color='#4cb36f')
plt.xlabel('Amount of sleep (hours)')
plt.ylabel('Frequency')
plt.show()
dist.mean()
7.85
# TODO: d