01 Introduction to sampling distributions
01 Introduction to sampling distributions#
%%html
<iframe width="700" height="400" src="https://www.youtube.com/embed/z0Ry_3_qhDw/" frameborder="0" allowfullscreen></iframe>
import itertools
import numpy as np
import pandas as pd
from pandas import Series, DataFrame
import matplotlib.pyplot as plt
import seaborn as sns
from scipy import stats, special
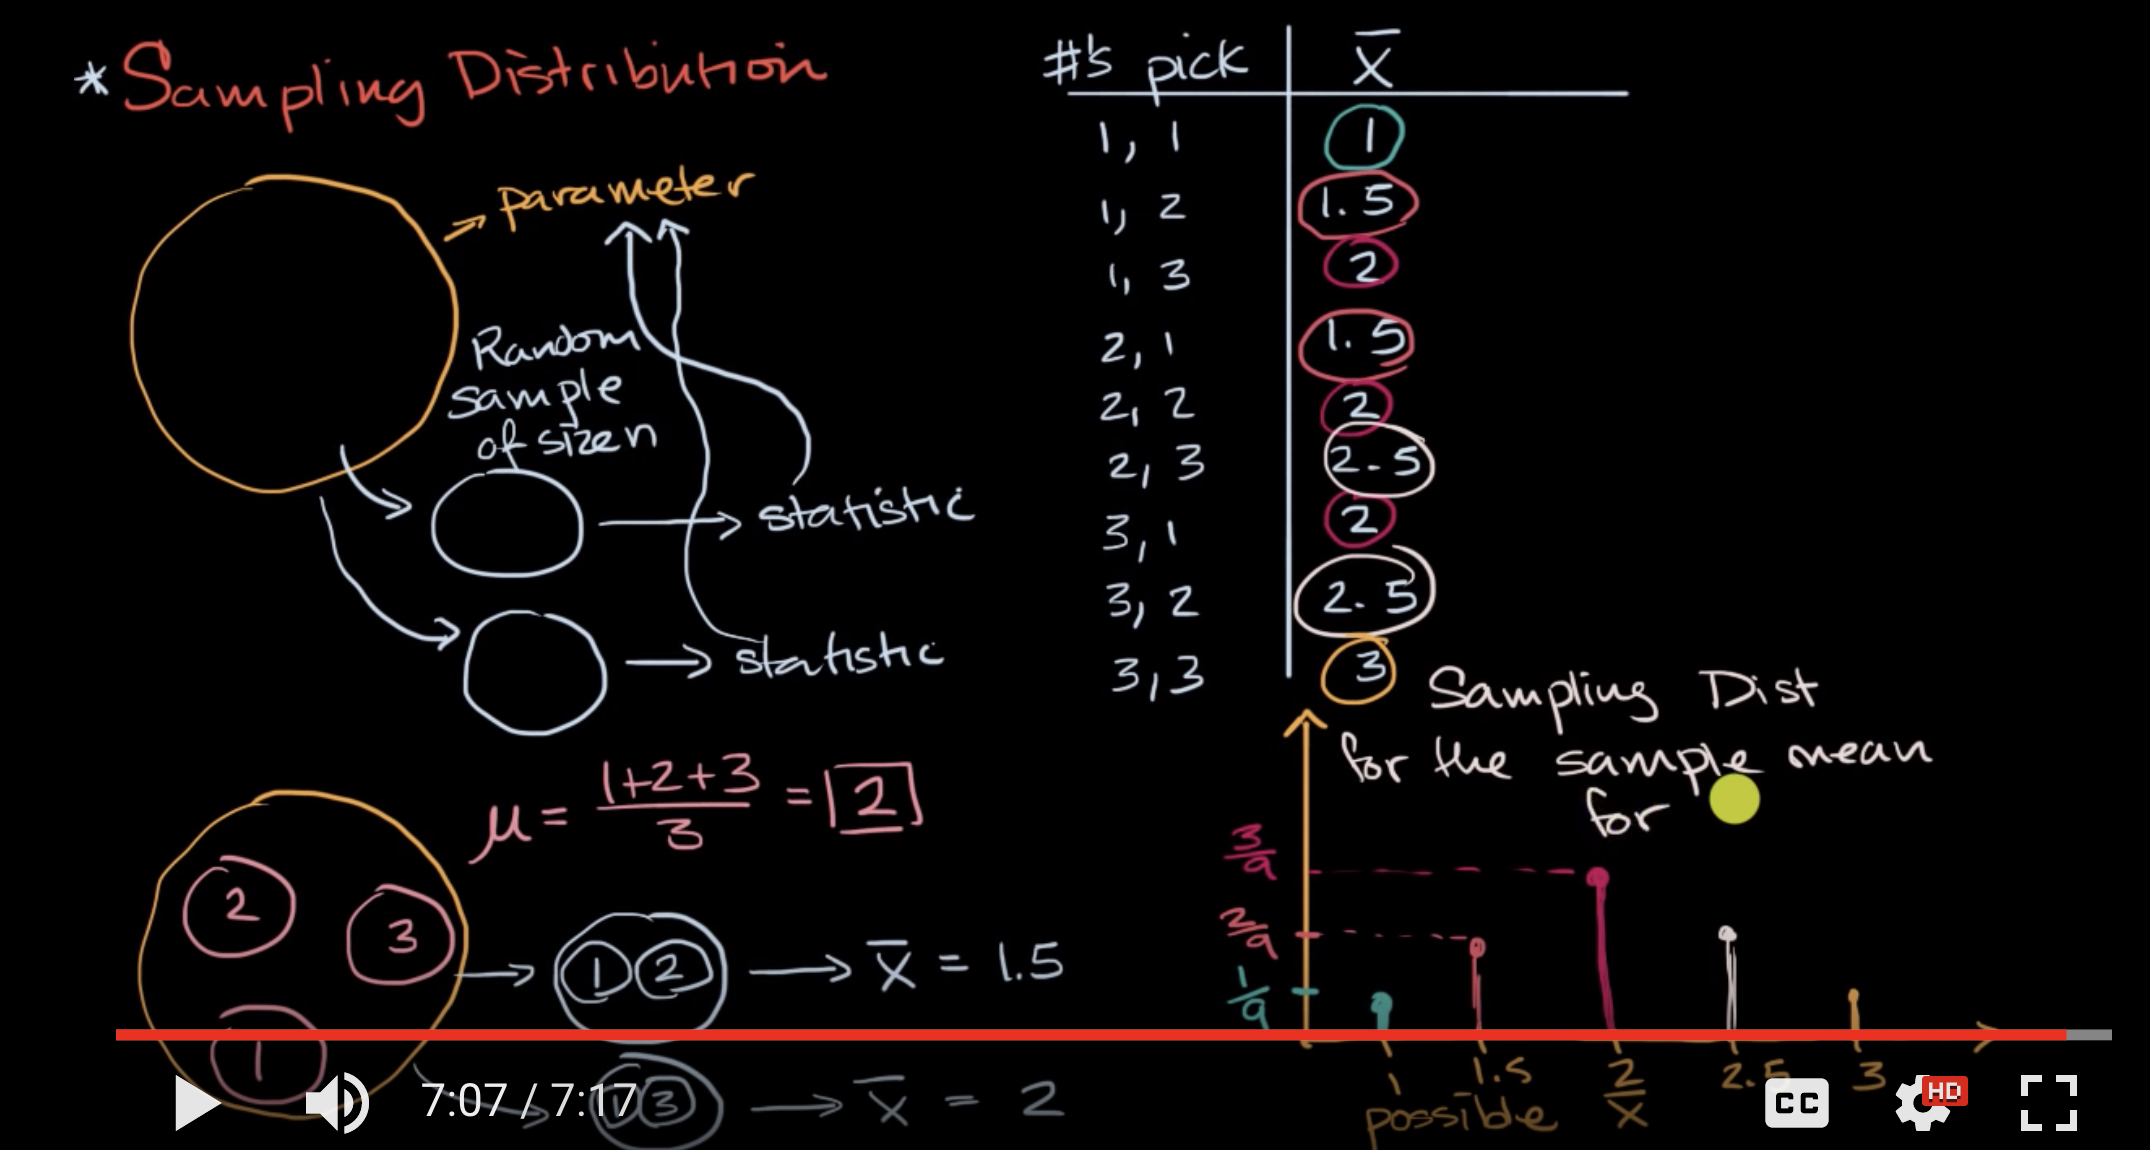
df = DataFrame({"#'s picks": list(itertools.product([1, 2, 3], repeat=2))})
df['X'] = [np.mean(i) for i in df["#'s picks"]]
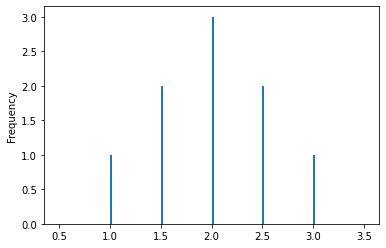
df
| #'s picks | X | |
|---|---|---|
| 0 | (1, 1) | 1.0 |
| 1 | (1, 2) | 1.5 |
| 2 | (1, 3) | 2.0 |
| 3 | (2, 1) | 1.5 |
| 4 | (2, 2) | 2.0 |
| 5 | (2, 3) | 2.5 |
| 6 | (3, 1) | 2.0 |
| 7 | (3, 2) | 2.5 |
| 8 | (3, 3) | 3.0 |
df['X'].plot(kind='hist',
             bins=np.arange(0.5, 4, 0.5),
             width=0.02)
<AxesSubplot:ylabel='Frequency'>
# np.random.sample, random.sample