17 Worked example - Creating a box plot (odd number of data points)#

%%html
<iframe width="700" height="400" src="https://www.youtube.com/embed/m6xURMj2ztk/" frameborder="0" allowfullscreen></iframe>
import numpy as np
import pandas as pd
from pandas import Series, DataFrame
import matplotlib.pyplot as plt

khanacademy

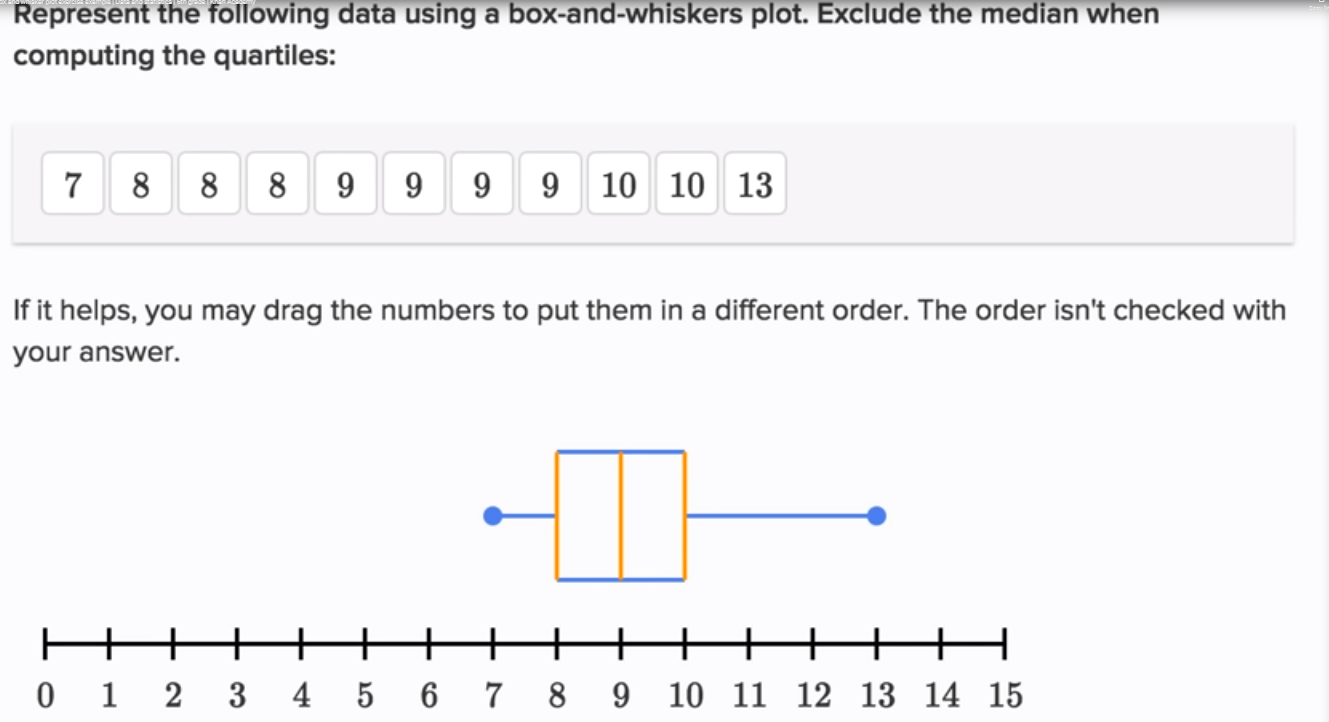
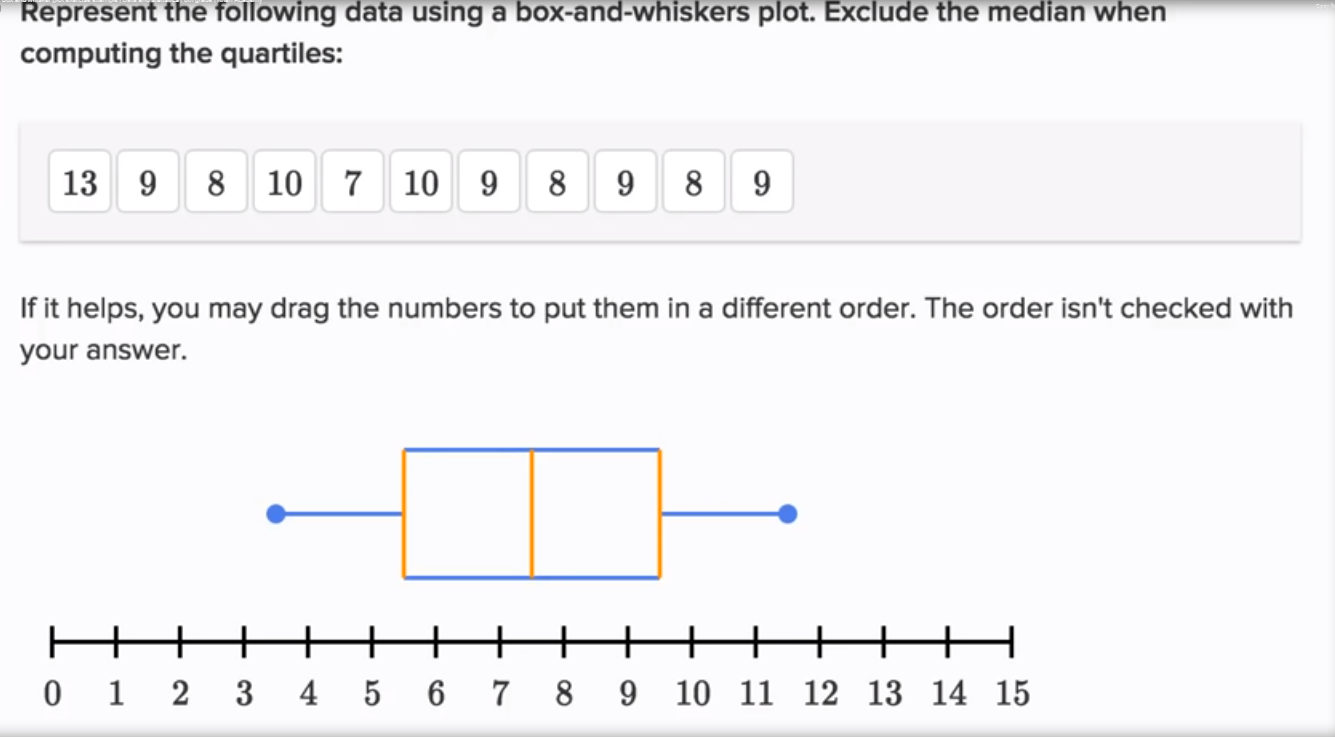
Worked example - Creating a box plot (odd number of data points) fig 1Worked example - Creating a box plot (odd number of data points) fig 2

x = Series([13,9,10,8,7,10,9,8,9,8,9])
x.plot(kind='box')
<AxesSubplot:>
../_images/17 Worked example - Creating a box plot (odd number of data points)_6_1.png
plt.boxplot(x)
plt.axes().set_yticks(range(15))
[<matplotlib.axis.YTick at 0x7f44e2f0dbb0>,
 <matplotlib.axis.YTick at 0x7f44e2f0d430>,
 <matplotlib.axis.YTick at 0x7f44e2f05370>,
 <matplotlib.axis.YTick at 0x7f44e2eba400>,
 <matplotlib.axis.YTick at 0x7f44e2ebab50>,
 <matplotlib.axis.YTick at 0x7f44e2ec12e0>,
 <matplotlib.axis.YTick at 0x7f44e2ec1a30>,
 <matplotlib.axis.YTick at 0x7f44e2ec81c0>,
 <matplotlib.axis.YTick at 0x7f44e2ec8910>,
 <matplotlib.axis.YTick at 0x7f44e2ec1cd0>,
 <matplotlib.axis.YTick at 0x7f44e2eba8e0>,
 <matplotlib.axis.YTick at 0x7f44e2ece0a0>,
 <matplotlib.axis.YTick at 0x7f44e2ece760>,
 <matplotlib.axis.YTick at 0x7f44e2ed5040>,
 <matplotlib.axis.YTick at 0x7f44e2ed5640>]
../_images/17 Worked example - Creating a box plot (odd number of data points)_7_1.png
# TODO: refactor and remove this warning