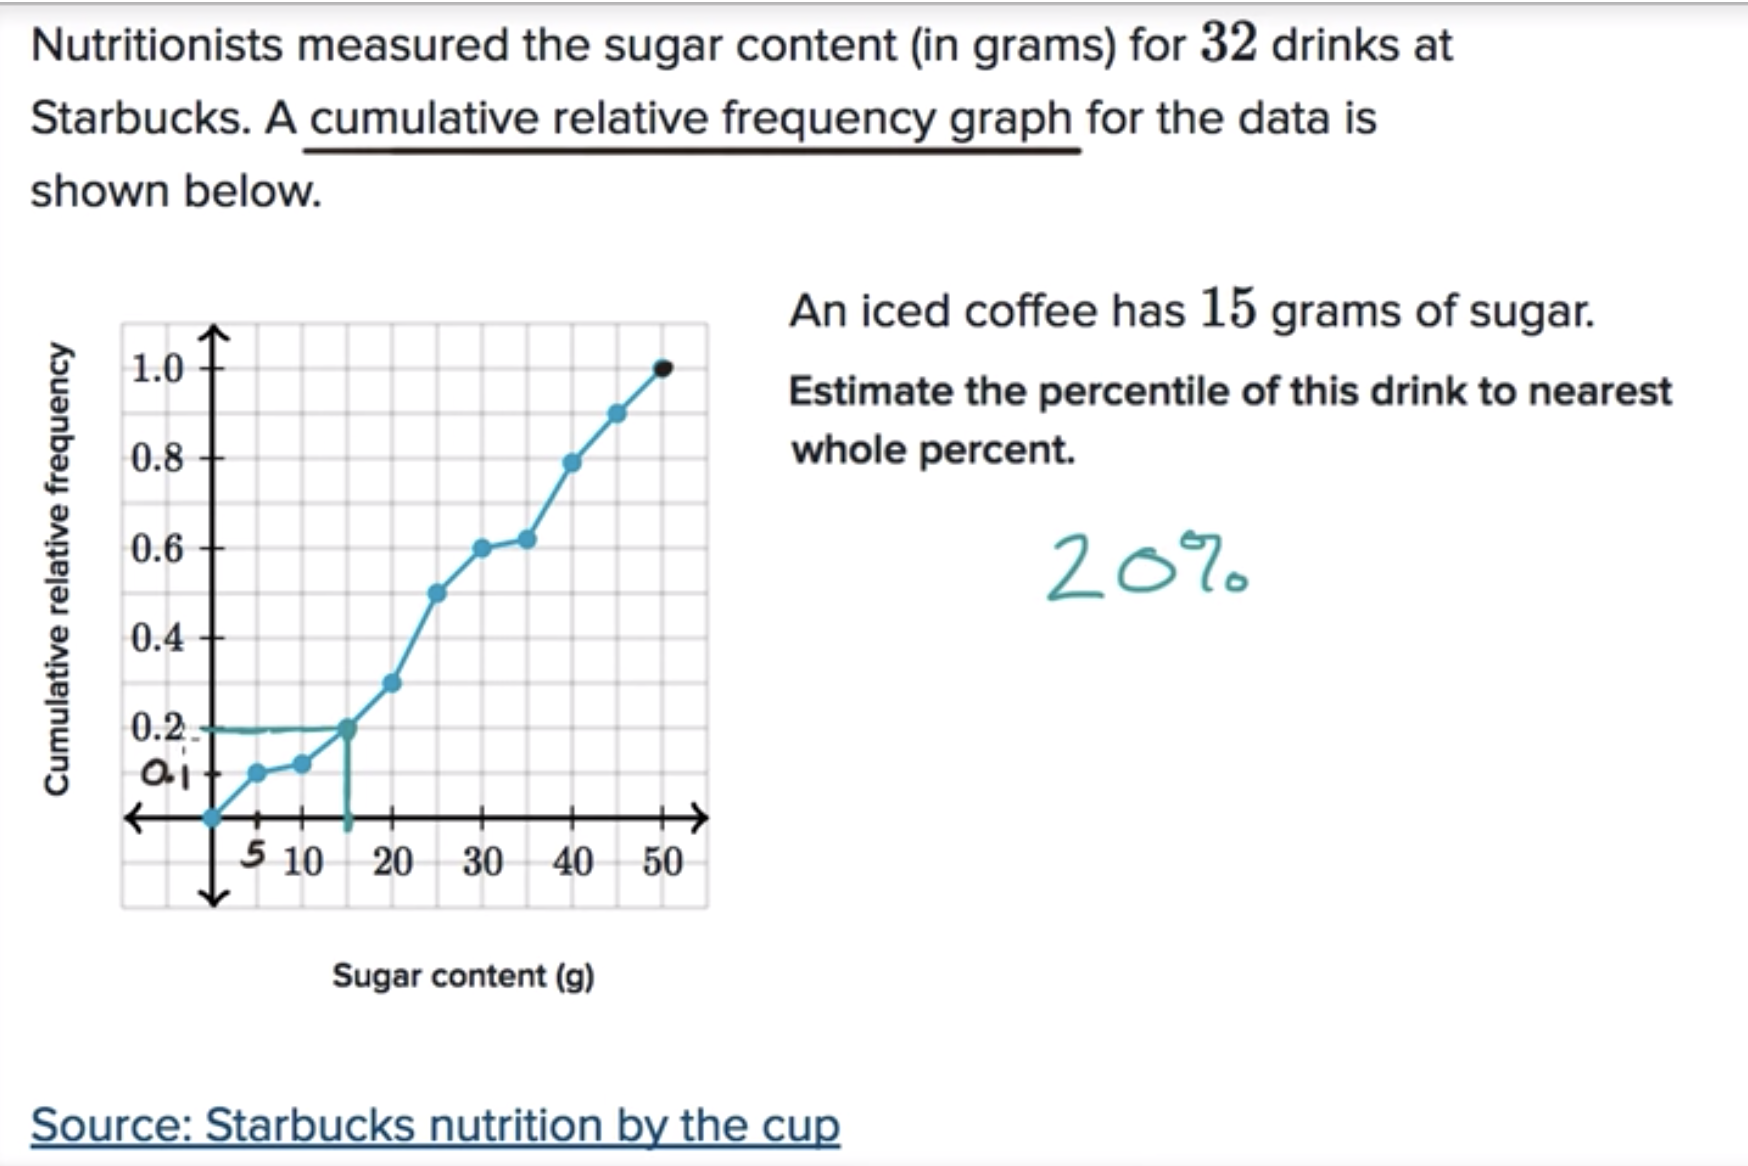
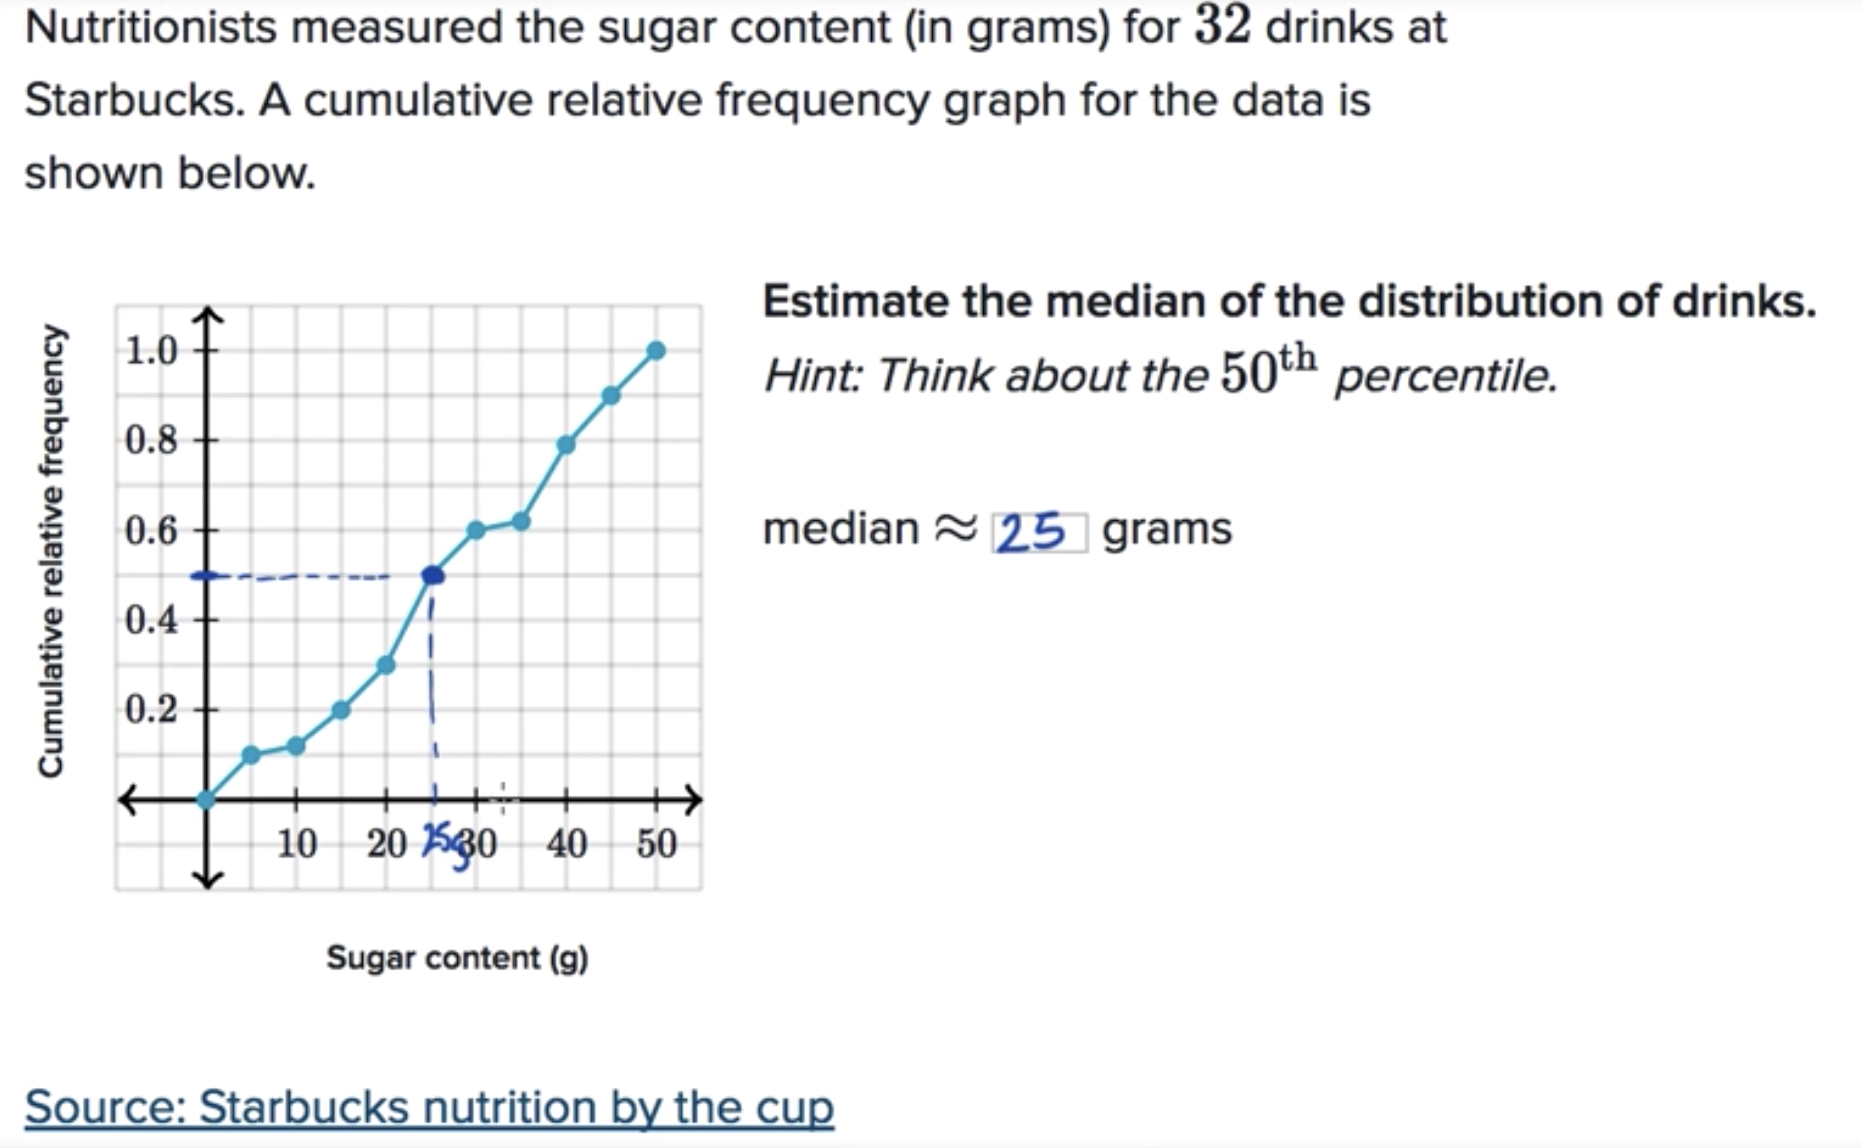
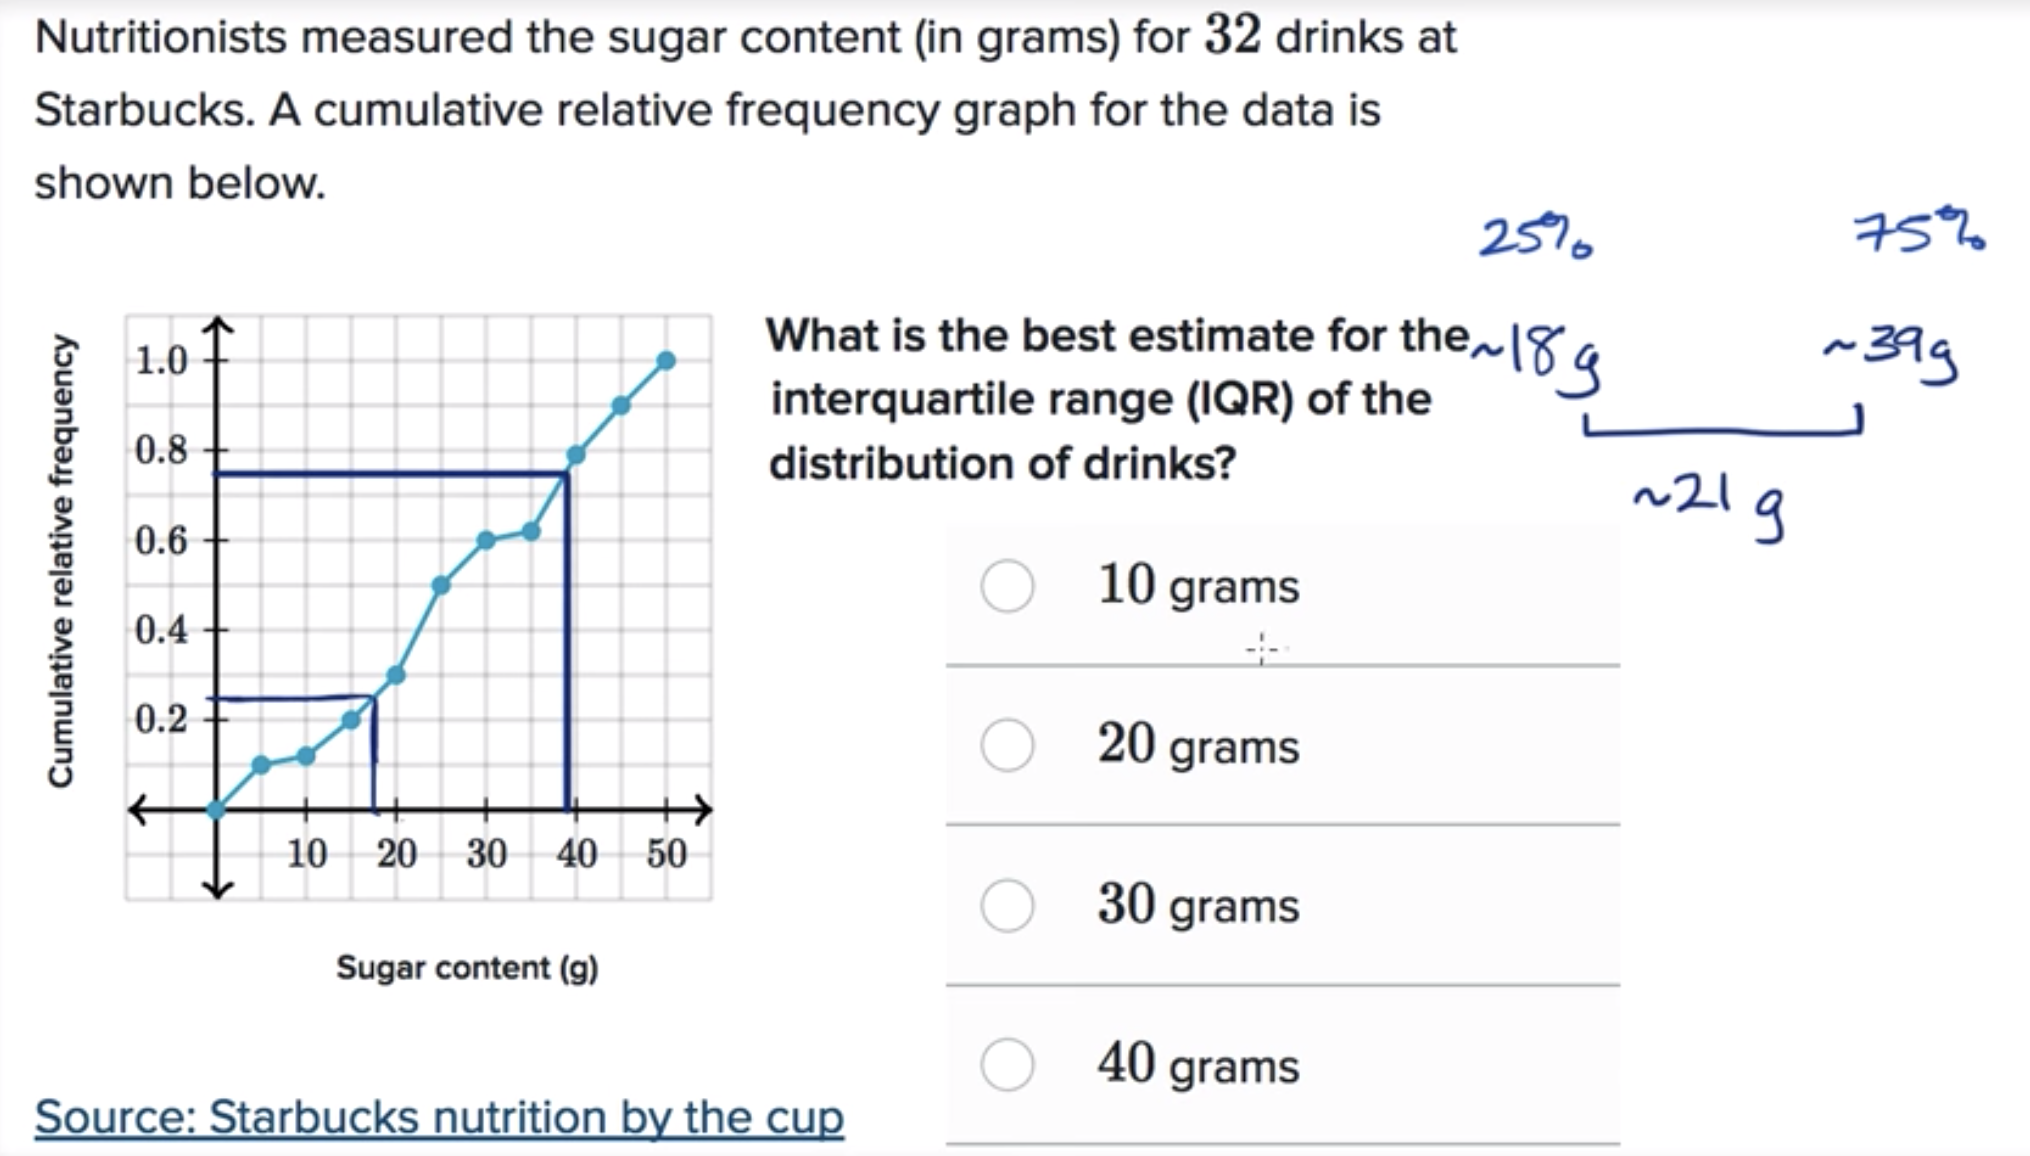
02 Analyzing a cumulative relative frequency graph
02 Analyzing a cumulative relative frequency graph#
%%html
<iframe width="700" height="400" src="https://www.youtube.com/embed/TwGYLQ-DNdc/" frameborder="0" allowfullscreen></iframe>
import numpy as np
import pandas as pd
from pandas import Series, DataFrame
import matplotlib.pyplot as plt
from scipy import stats


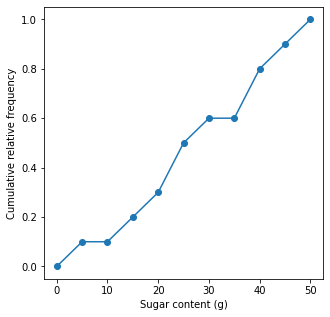
sugar_content = np.arange(0, 55, 5)
crf = np.array([0, 0.1, 0.1, 0.2, 0.3, 0.5, 0.6, 0.6, 0.8, 0.9, 1.0])
np.mean(sugar_content)
25.0
np.percentile(sugar_content, 50)
25.0
np.percentile(sugar_content, 75) - np.percentile(sugar_content, 25)
25.0
stats.iqr(sugar_content)
25.0
plt.figure(figsize=(5, 5))
plt.plot(sugar_content, crf, '-o')
plt.xlabel('Sugar content (g)')
plt.ylabel('Cumulative relative frequency')
plt.show()

# TODO: fixing IQR

