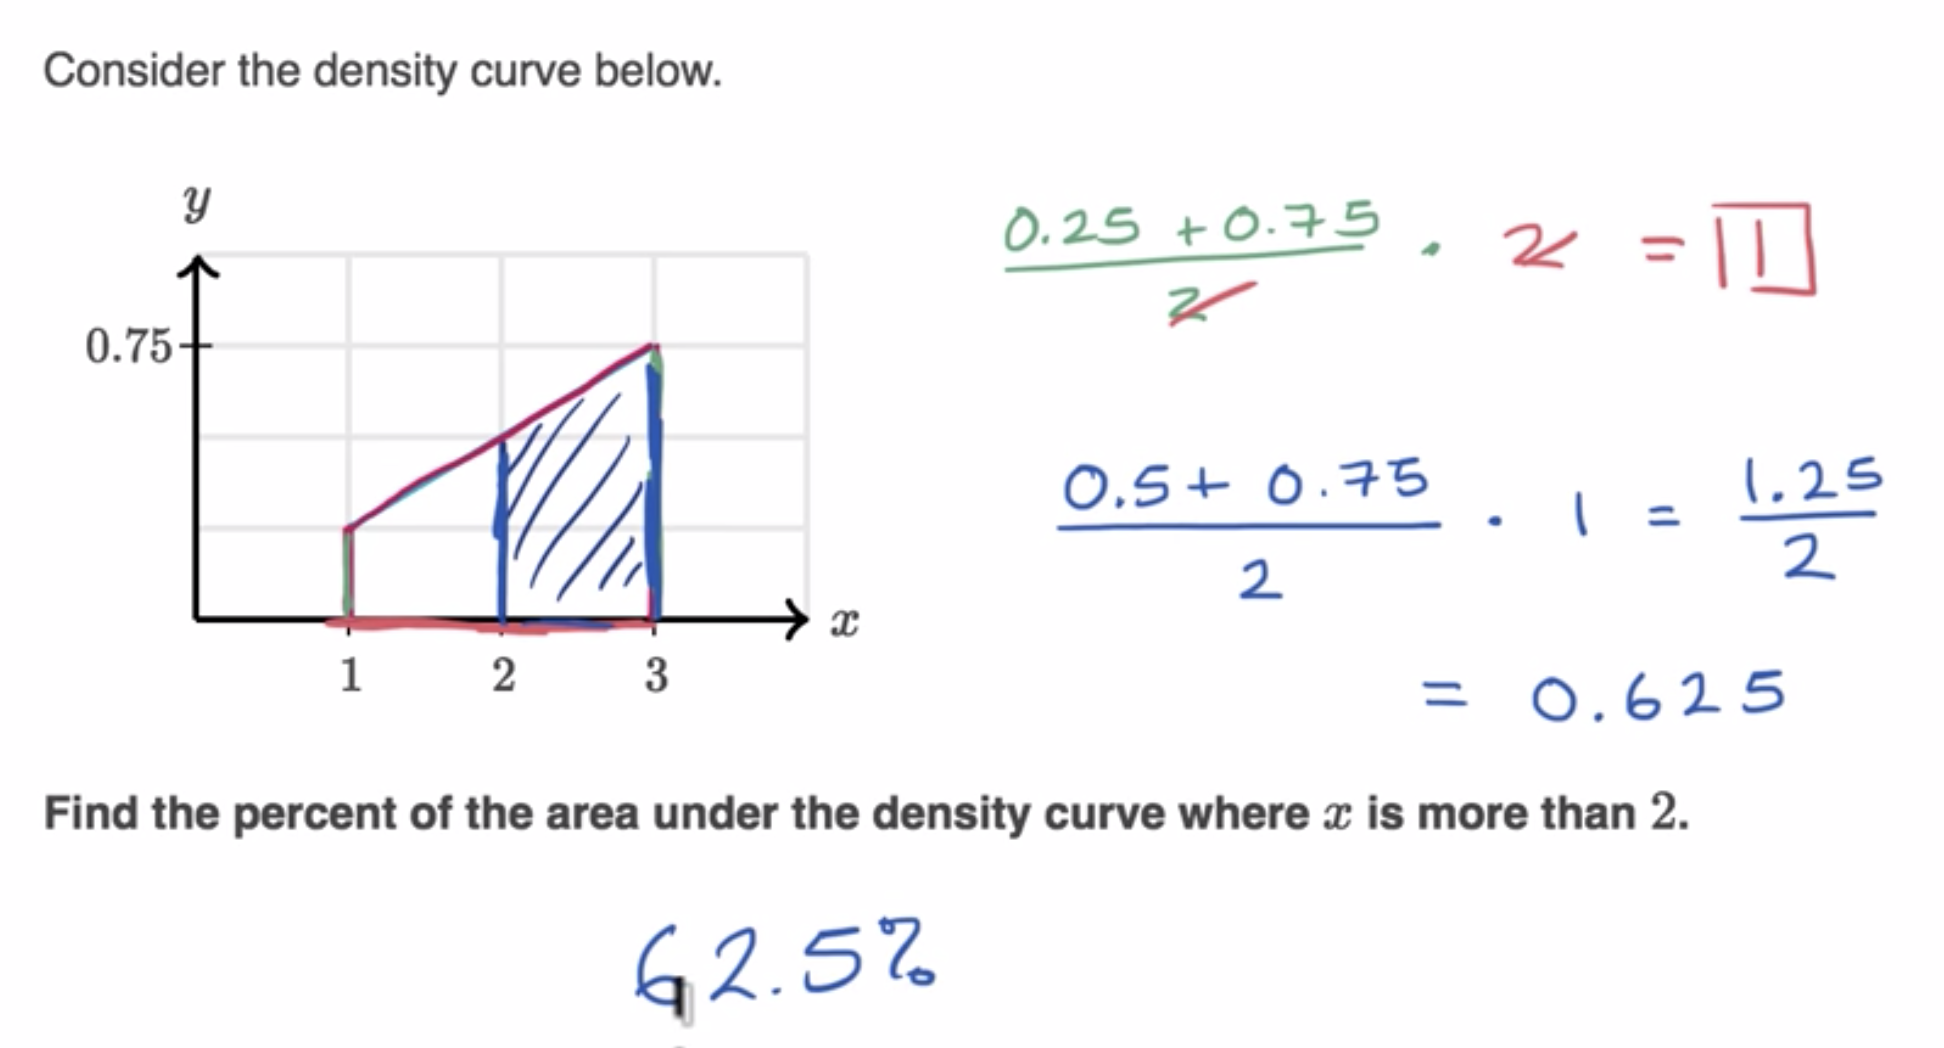
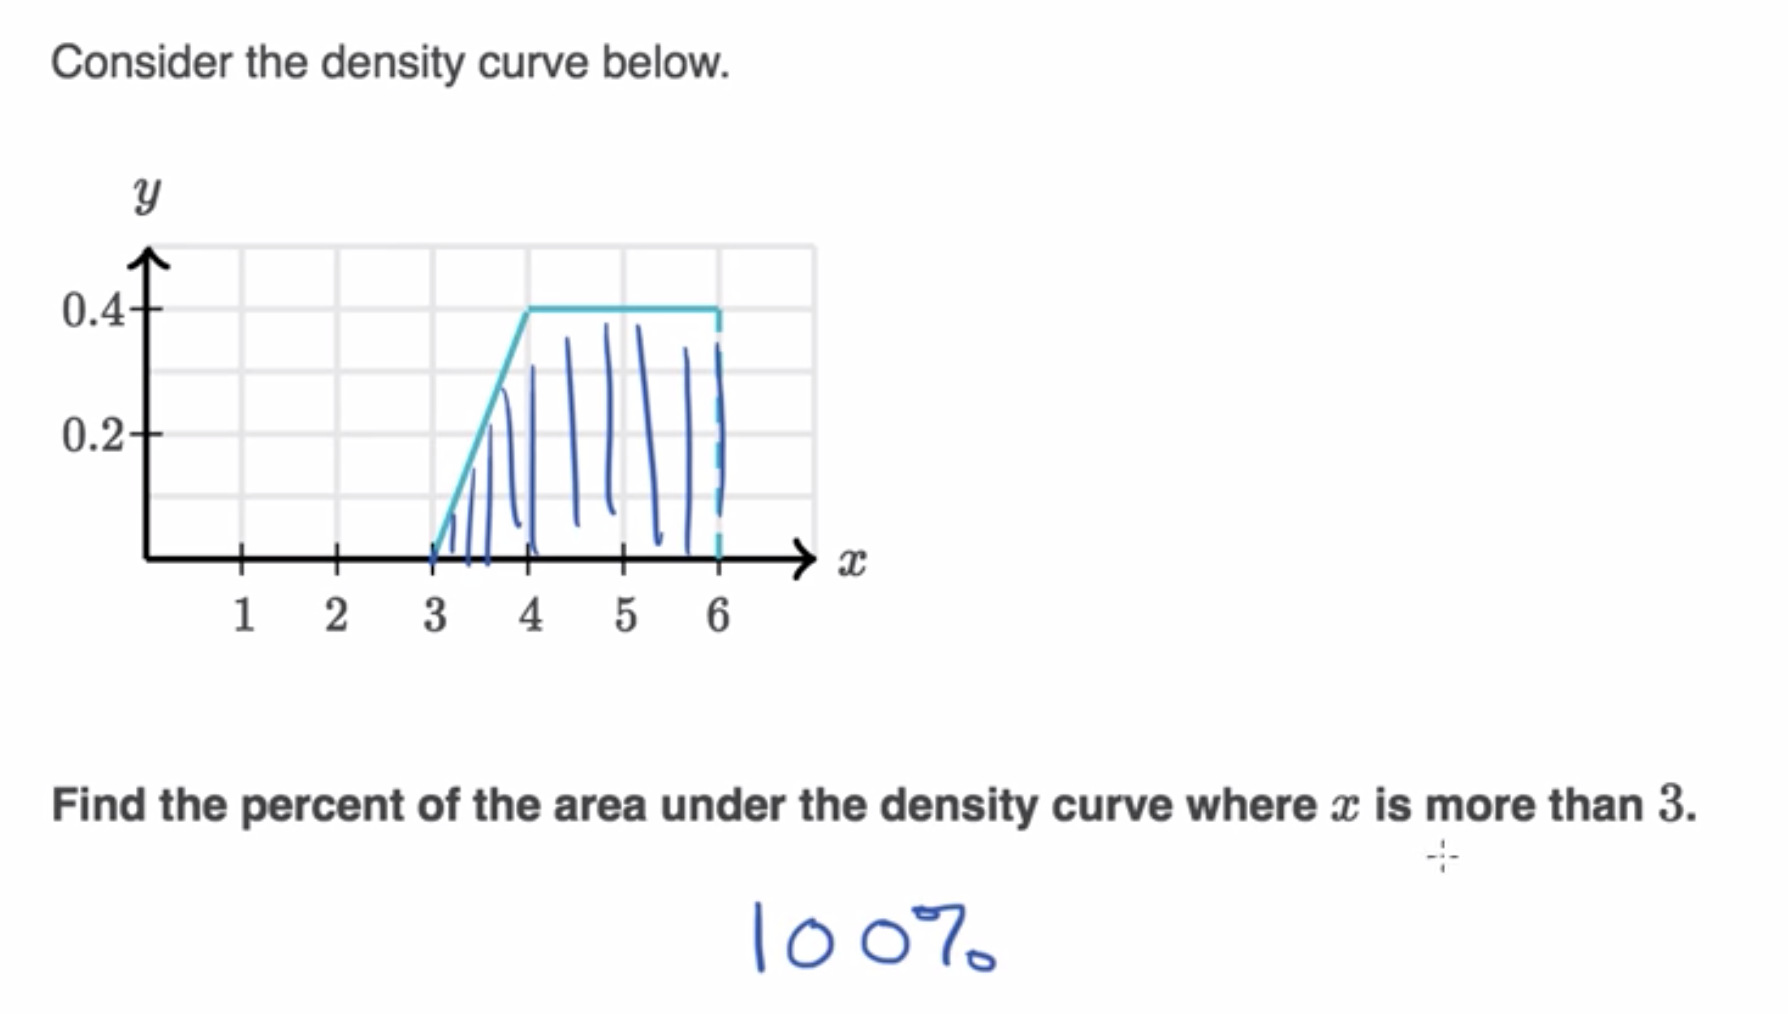
09 Worked example finding area under density curves
09 Worked example finding area under density curves#
%%html
<iframe width="700" height="400" src="https://www.youtube.com/embed/Tu3O9tC3Eh8/" frameborder="0" allowfullscreen></iframe>
import numpy as np
import pandas as pd
from pandas import Series, DataFrame
import matplotlib.pyplot as plt
import seaborn as sns
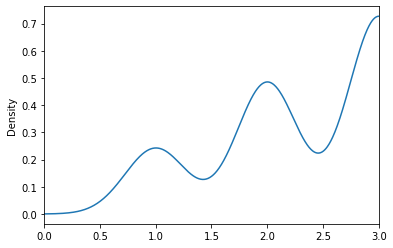
x = Series(25 * [1] + 50 * [2] + 75 * [3])
x.plot(kind='density', xlim=[0, 3])
<AxesSubplot:ylabel='Density'>
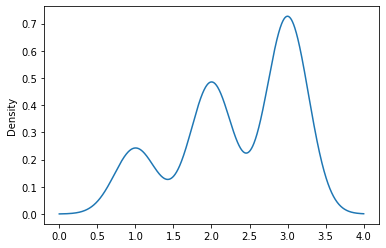
y = Series(2 * [3.5] + 4 * [4] + 4 * [5] + 4 * [6])
x.plot(kind='density')
<AxesSubplot:ylabel='Density'>
# find a way to plot 'em better