21 Graphing basketball binomial distribution
21 Graphing basketball binomial distribution#
%%html
<iframe width="700" height="400" src="https://www.youtube.com/embed/y2G03Lumhe0/" frameborder="0" allowfullscreen></iframe>
import numpy as np
import pandas as pd
from pandas import Series, DataFrame
import matplotlib.pyplot as plt
import seaborn as sns
from scipy import stats, special
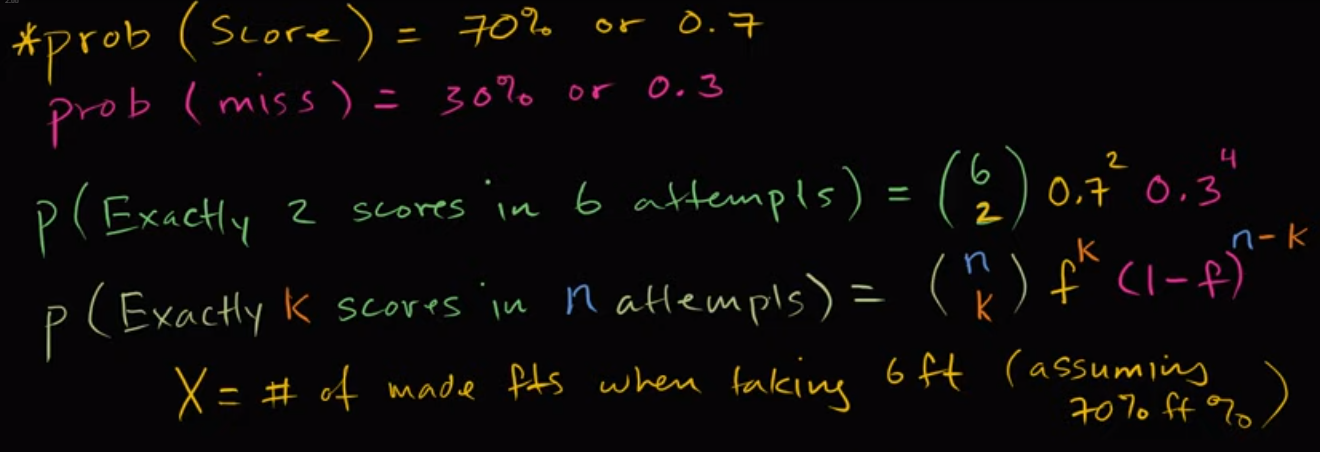
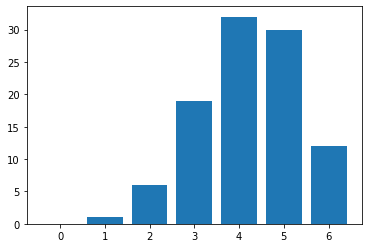
n = 6
f = 0.7
x = range(7)
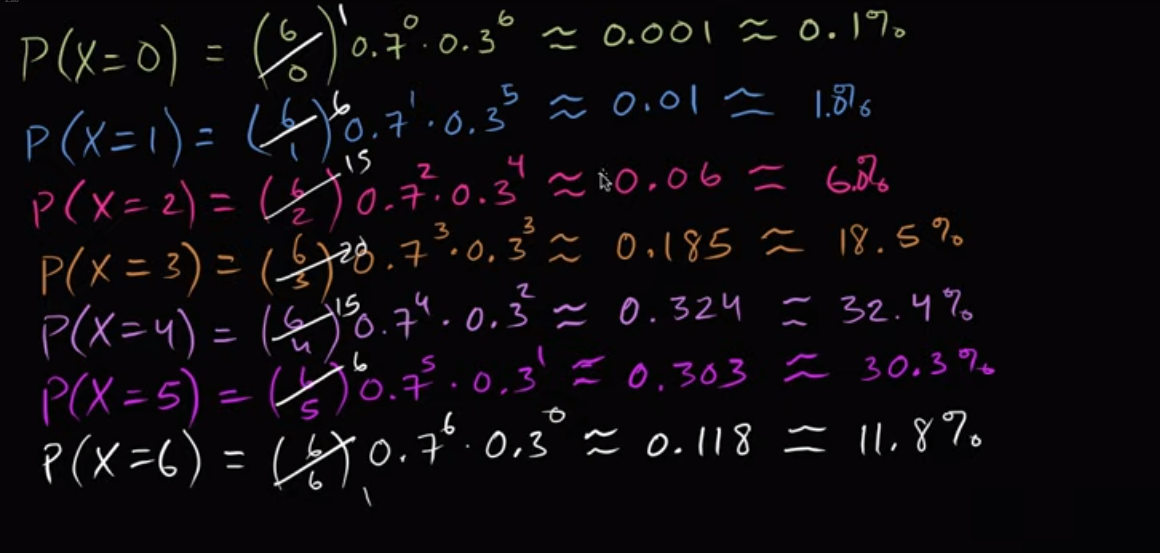
y = np.array([special.comb(n, k) * f ** k * (1-f)**(n - k) for k in x])
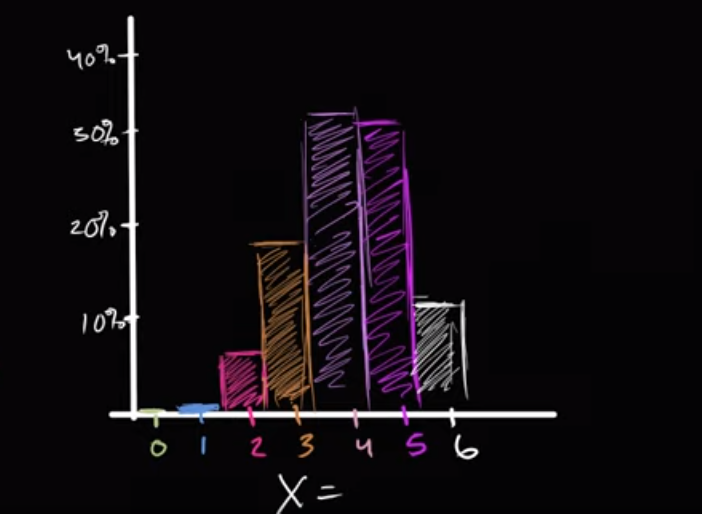
y = np.round(y * 100)
plt.bar(x, y)
<BarContainer object of 7 artists>
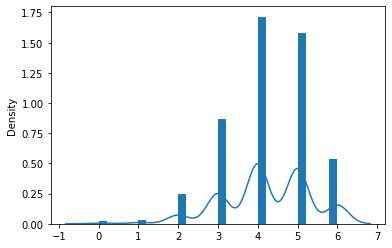
binom_data = stats.binom.rvs(n=6, p=0.7, size=1000)
sns.distplot(binom_data, hist_kws={'alpha': 1})
/opt/hostedtoolcache/Python/3.9.13/x64/lib/python3.9/site-packages/seaborn/distributions.py:2619: FutureWarning: `distplot` is a deprecated function and will be removed in a future version. Please adapt your code to use either `displot` (a figure-level function with similar flexibility) or `histplot` (an axes-level function for histograms).
  warnings.warn(msg, FutureWarning)
<AxesSubplot:ylabel='Density'>