04 Calculating correlation coefficient r
04 Calculating correlation coefficient r#
%%html
<iframe width="700" height="400" src="https://www.youtube.com/embed/u4ugaNo6v1Q/" frameborder="0" allowfullscreen></iframe>
import numpy as np
import pandas as pd
from pandas import Series, DataFrame
import matplotlib.pyplot as plt
import seaborn as sns
from scipy import stats
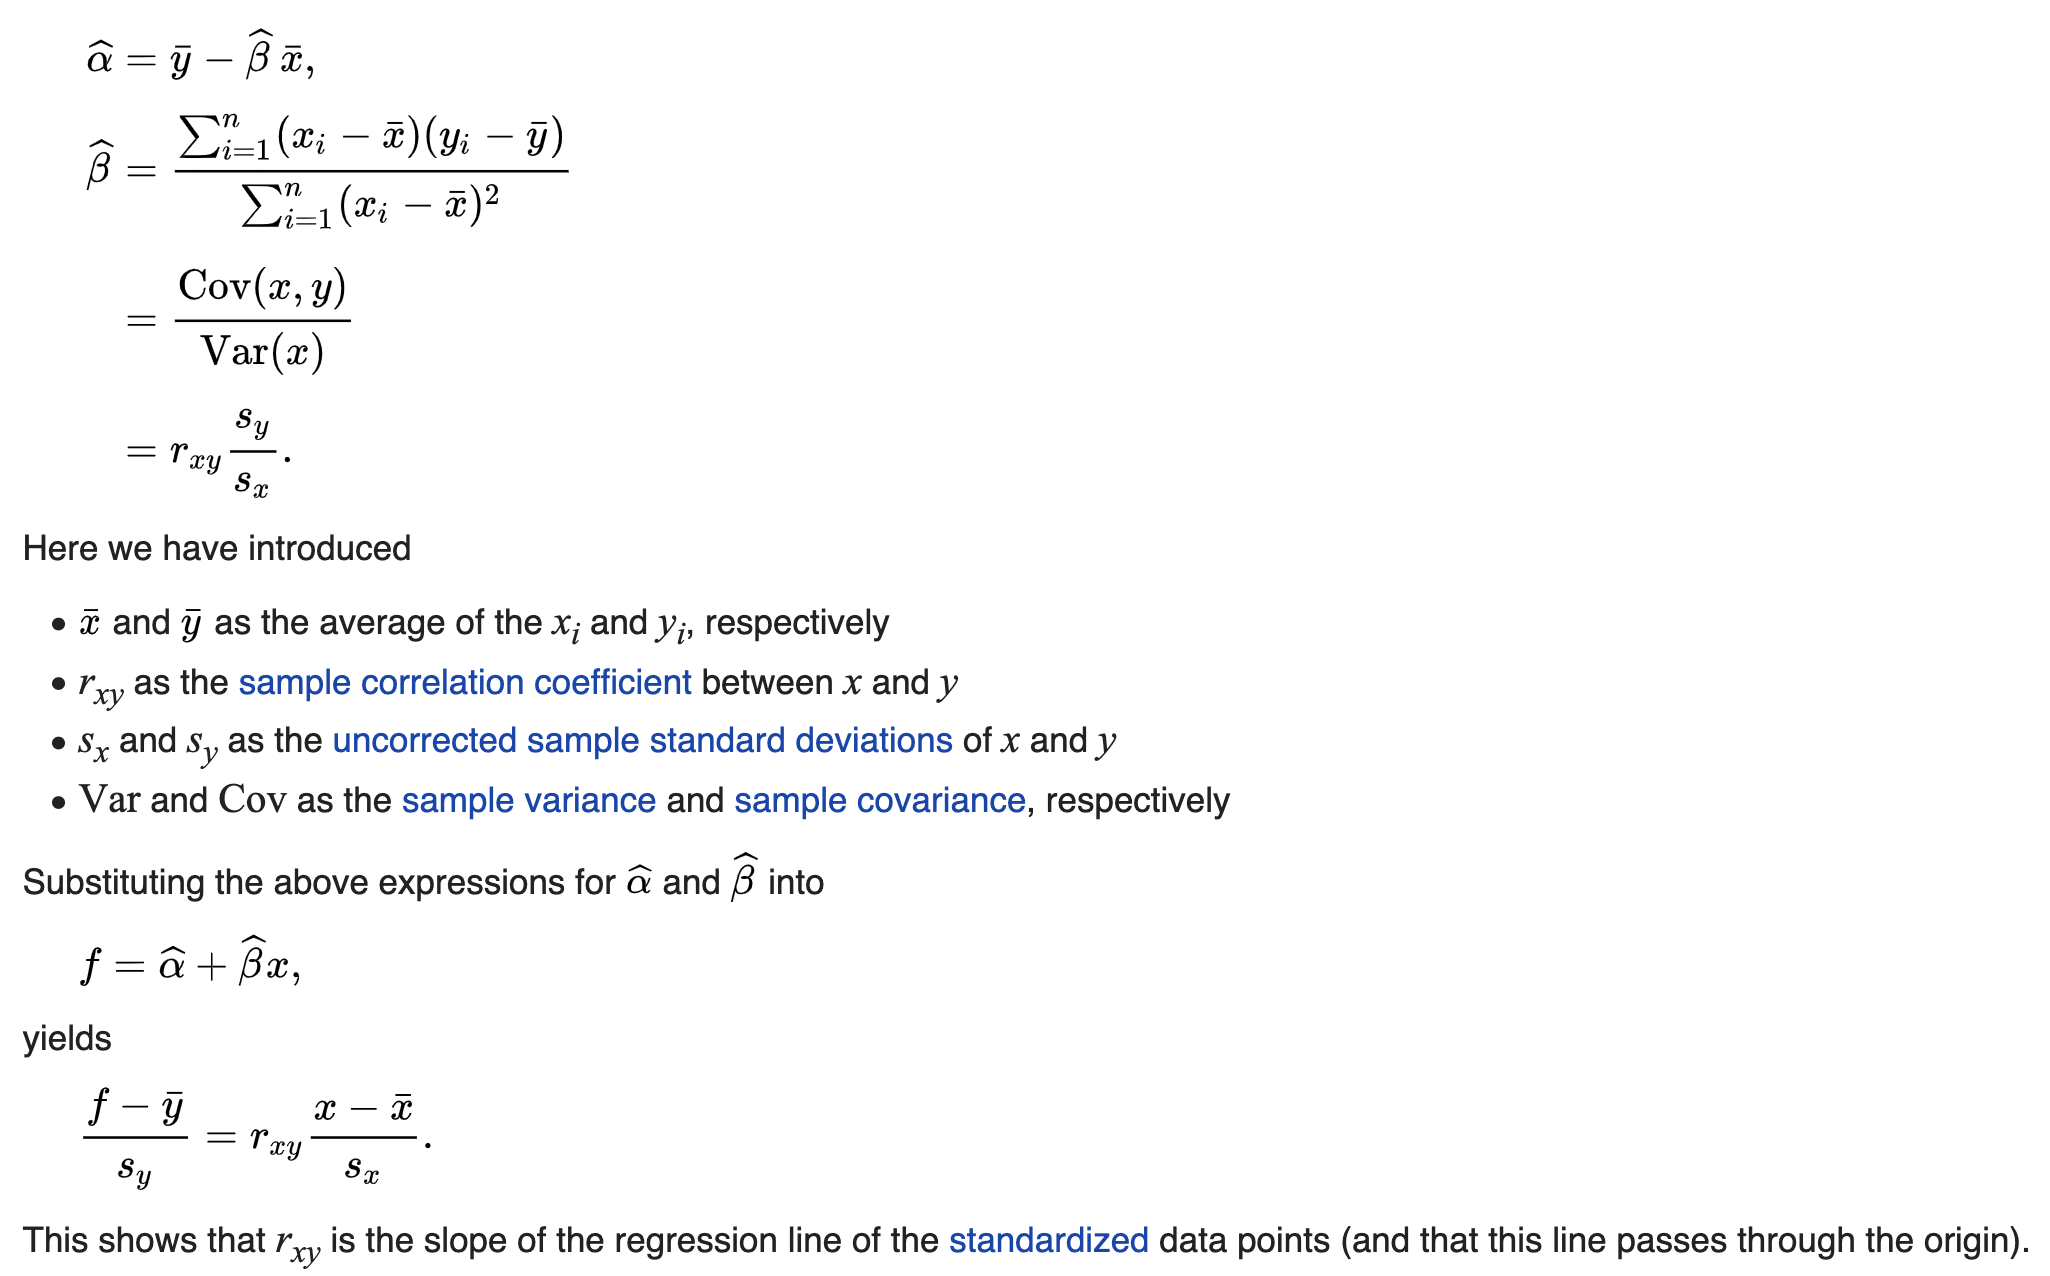
https://en.wikipedia.org/wiki/Simple_linear_regression
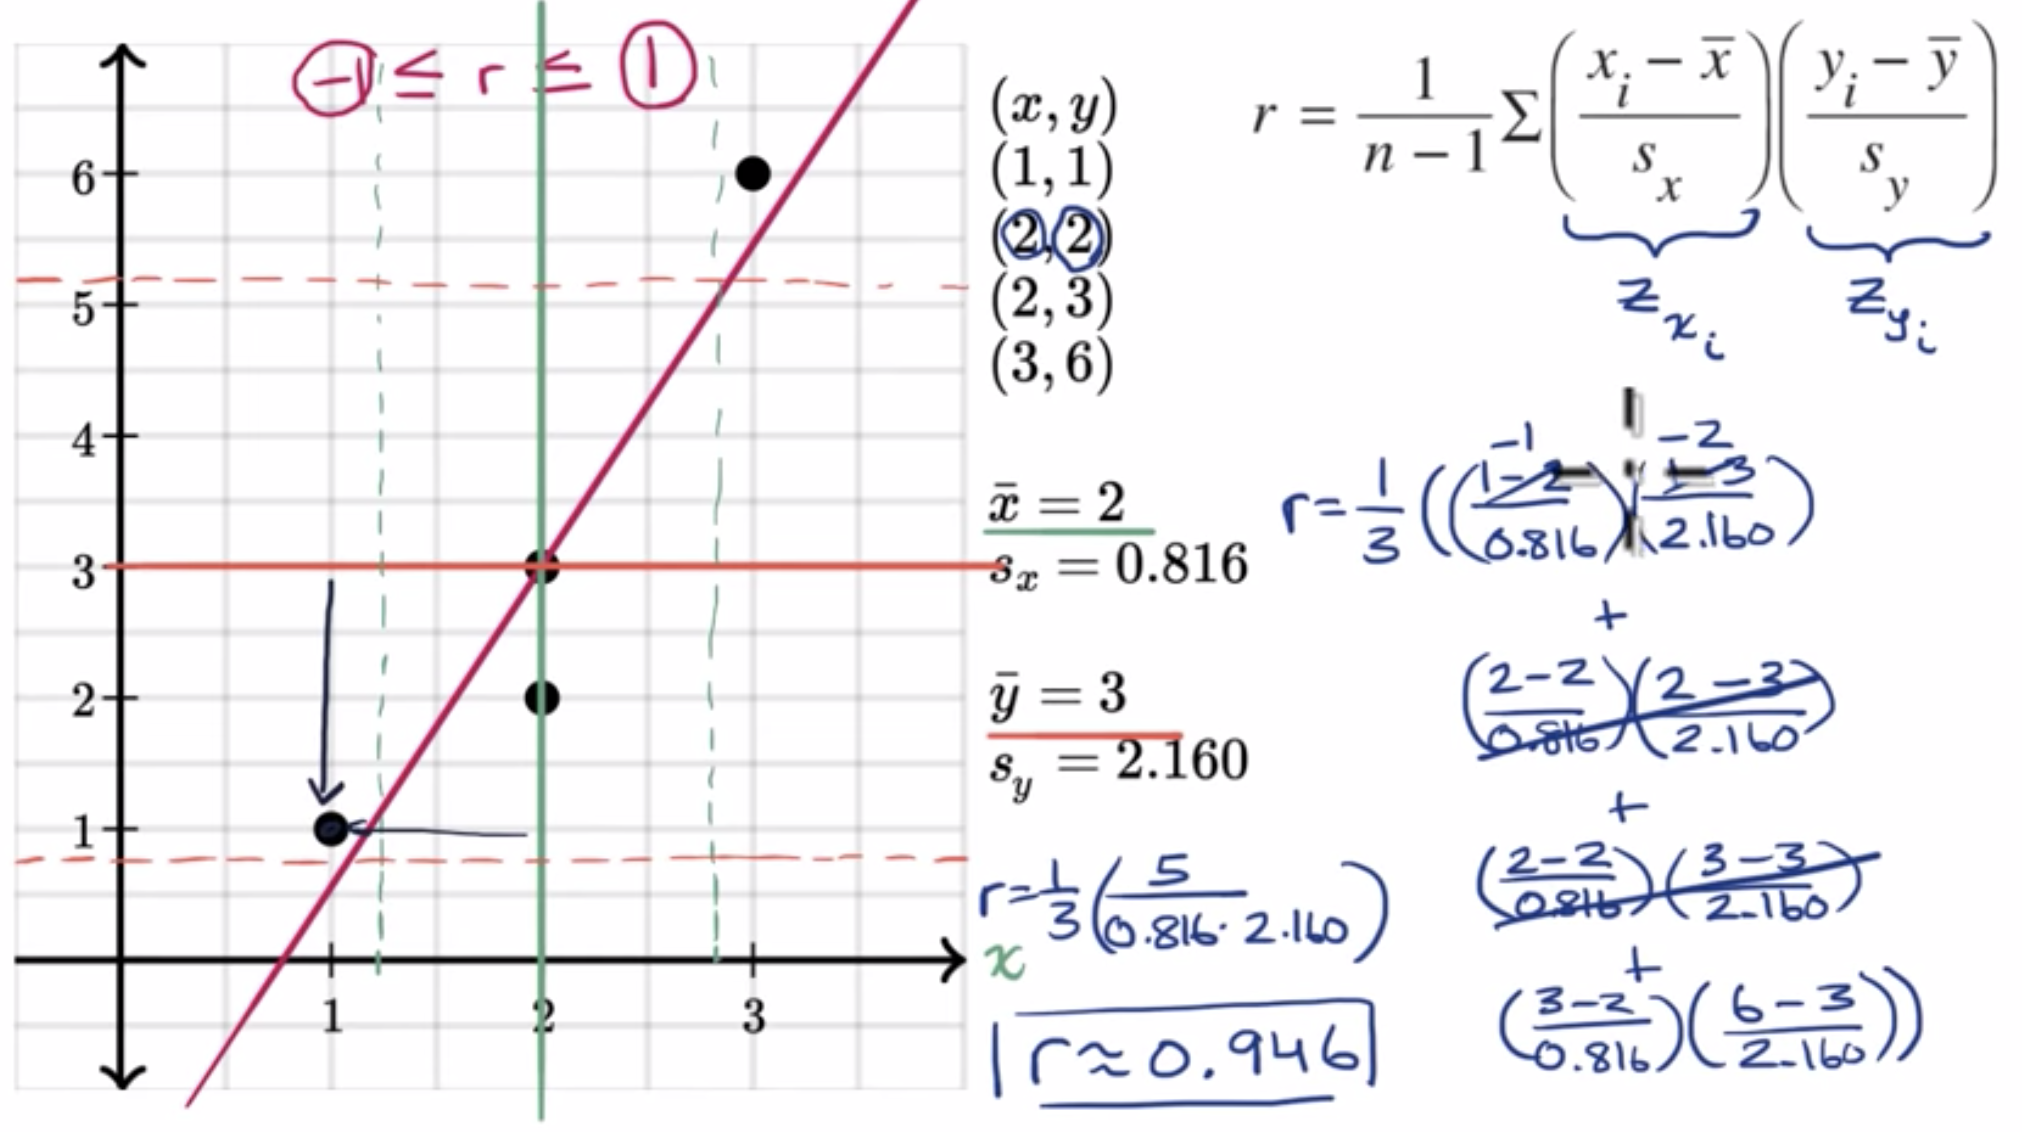
\[ r = \frac{1}{n-1} \sum \frac{x_{i} - \bar{x}}{S_{x}} \frac{y_{i} - \bar{y}}{S_{y}} \]
x = np.array([1, 2, 2, 3])
y = np.array([1, 2, 3, 6])
x_mean = x.mean()
x_std = x.std(ddof=1)
y_mean = y.mean()
y_std = y.std(ddof=1)
x_mean, x_std, y_mean, y_std
(2.0, 0.816496580927726, 3.0, 2.160246899469287)
slope, intercept, rvalue, pvalue, stderr = stats.linregress(x, y)
reg_line = intercept + slope * x
reg_line
array([0.5, 3. , 3. , 5.5])
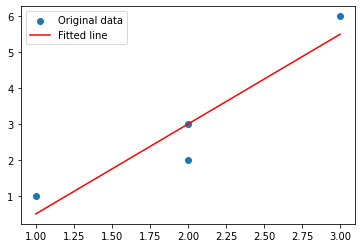
plt.scatter(x, y, label='Original data')
plt.plot(x, reg_line, color='r', label='Fitted line')
plt.legend()
plt.show()
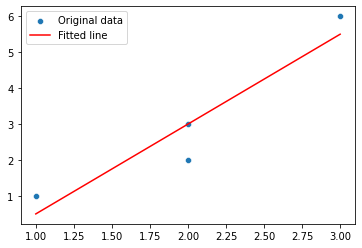
sns.scatterplot(x, y, label='Original data')
sns.lineplot(x, reg_line, color='r', label='Fitted line')
/opt/hostedtoolcache/Python/3.9.13/x64/lib/python3.9/site-packages/seaborn/_decorators.py:36: FutureWarning: Pass the following variables as keyword args: x, y. From version 0.12, the only valid positional argument will be `data`, and passing other arguments without an explicit keyword will result in an error or misinterpretation.
  warnings.warn(
<AxesSubplot:>
def cal_corr(x, y):
    n = len(x)
    zscore_x = stats.zscore(x, ddof=1)
    zscore_y = stats.zscore(y, ddof=1)
    return 1 / (n -1) * np.sum(zscore_x * zscore_y)
cal_corr(x, y)
0.9449111825230678
#Pearson’s Correlation
corr, _ = stats.pearsonr(x, y)
corr
0.944911182523068
rvalue
0.944911182523068
# note there's other ways to calculate correlation coefficient