09 Mosaic plots and segmented bar charts
Contents
09 Mosaic plots and segmented bar charts#
%%html
<iframe width="700" height="400" src="https://www.youtube.com/embed/b9G5pWuxb1Y/" frameborder="0" allowfullscreen></iframe>
import matplotlib.pyplot as plt
import numpy as np
import pandas as pd
import plotly.graph_objects as go
import seaborn as sns
from statsmodels.graphics.mosaicplot import mosaic
import findspark

findspark.init()
from pyspark.context import SparkContext
from pyspark.sql import functions as F
from pyspark.sql.session import SparkSession

spark = SparkSession.builder.appName("statistics").master("local").getOrCreate()
WARNING: An illegal reflective access operation has occurred
WARNING: Illegal reflective access by org.apache.spark.unsafe.Platform (file:/home/runner/work/statistics/spark-3.1.3-bin-hadoop3.2/jars/spark-unsafe_2.12-3.1.3.jar) to constructor java.nio.DirectByteBuffer(long,int)
WARNING: Please consider reporting this to the maintainers of org.apache.spark.unsafe.Platform
WARNING: Use --illegal-access=warn to enable warnings of further illegal reflective access operations
WARNING: All illegal access operations will be denied in a future release
22/07/21 02:32:54 WARN NativeCodeLoader: Unable to load native-hadoop library for your platform... using builtin-java classes where applicable
Using Spark's default log4j profile: org/apache/spark/log4j-defaults.properties
Setting default log level to "WARN".
To adjust logging level use sc.setLogLevel(newLevel). For SparkR, use setLogLevel(newLevel).
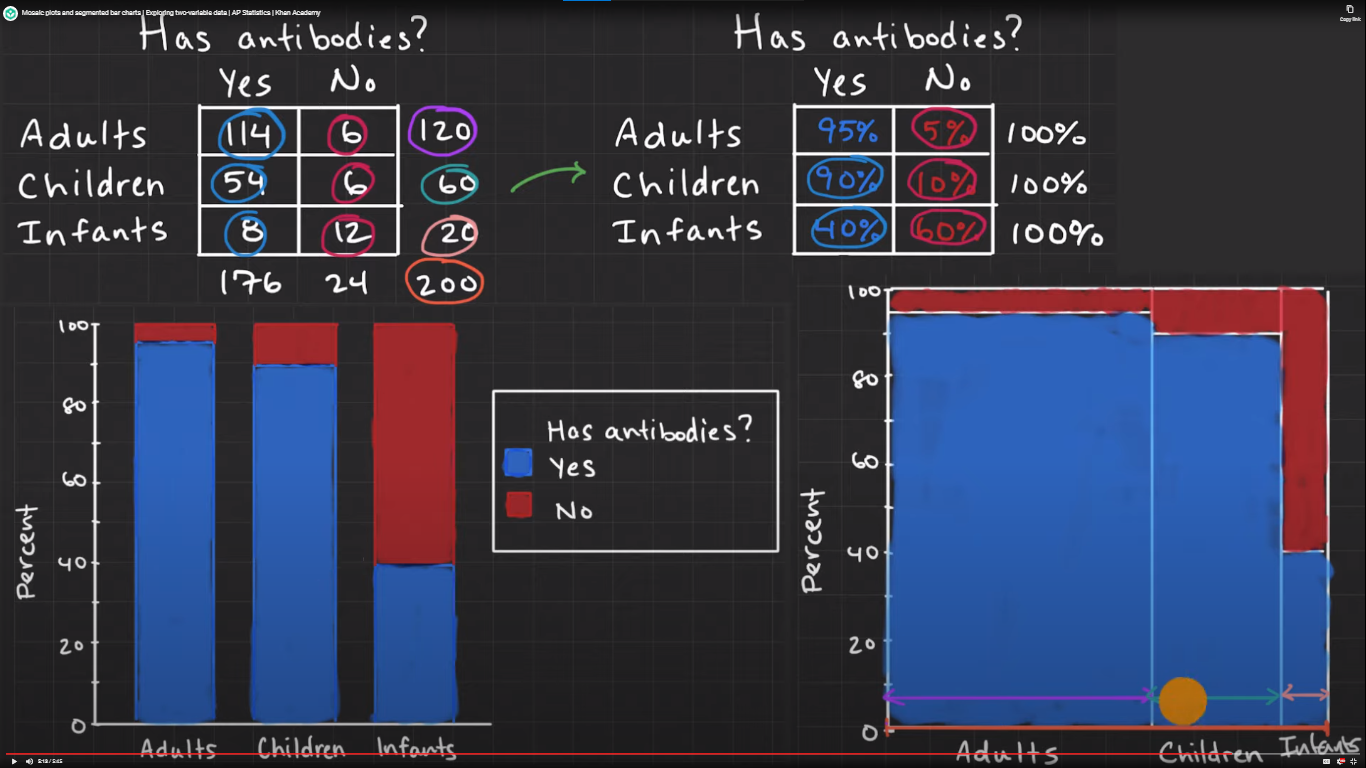
dataset = {
    "Age": ["Adults", "Children", "Infants"],
    "Yes": [114, 54, 8],
    "No": [6, 6, 12],
}
df = pd.DataFrame(dataset).set_index("Age")
df
| Yes | No | |
|---|---|---|
| Age | ||
| Adults | 114 | 6 |
| Children | 54 | 6 |
| Infants | 8 | 12 |
sdf = spark.createDataFrame(zip(*dataset.values()), schema=list(dataset.keys()))
sdf.show()
[Stage 0:> (0 + 1) / 1]
+--------+---+---+
|     Age|Yes| No|
+--------+---+---+
|  Adults|114|  6|
|Children| 54|  6|
| Infants|  8| 12|
+--------+---+---+
df_pct = df.copy()
df_pct["sum"] = df_pct["Yes"] + df_pct["No"]
df_pct["Yes"] = df_pct["Yes"] * 100 / df_pct["sum"]
df_pct["No"] = df_pct["No"] * 100 / df_pct["sum"]
df_pct = df_pct.drop(columns=["sum"])
df_pct
| Yes | No | |
|---|---|---|
| Age | ||
| Adults | 95.0 | 5.0 |
| Children | 90.0 | 10.0 |
| Infants | 40.0 | 60.0 |
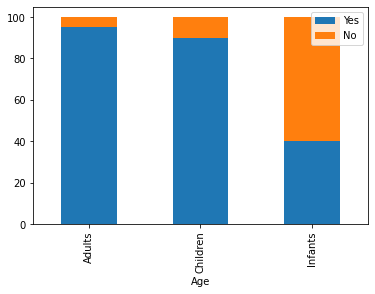
Segmented bar chart#
df_pct.plot(kind="bar", stacked=True)
<AxesSubplot:xlabel='Age'>
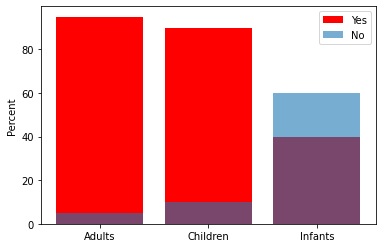
plt.bar(df_pct.index, df_pct["Yes"], color="red")
plt.bar(df_pct.index, df_pct["No"], alpha=0.6)
plt.legend(["Yes", "No"])
plt.ylabel("Percent")
Text(0, 0.5, 'Percent')
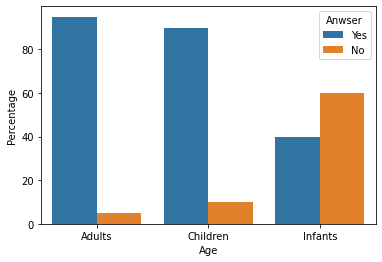
melt_df = df_pct.reset_index().melt(
    id_vars="Age", var_name="Anwser", value_name="Percentage"
)
melt_df
| Age | Anwser | Percentage | |
|---|---|---|---|
| 0 | Adults | Yes | 95.0 |
| 1 | Children | Yes | 90.0 |
| 2 | Infants | Yes | 40.0 |
| 3 | Adults | No | 5.0 |
| 4 | Children | No | 10.0 |
| 5 | Infants | No | 60.0 |
sns.barplot(x="Age", y="Percentage", hue="Anwser", data=melt_df)
<AxesSubplot:xlabel='Age', ylabel='Percentage'>
data = [
    go.Bar(x=df_pct.index, y=df_pct["Yes"], name="Yes"),
    go.Bar(x=df_pct.index, y=df_pct["No"], name="No"),
]
layout = go.Layout(barmode="stack")
fig = go.Figure(data, layout)
fig.show()
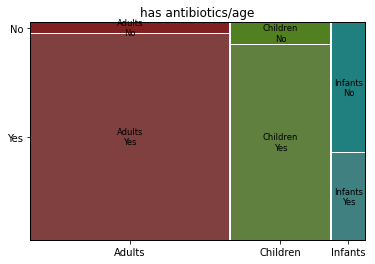
Mosaic plot#
mosaic(df.stack(), title="has antibiotics/age")
(<Figure size 432x288 with 3 Axes>,
 {('Adults', 'Yes'): (0.0, 0.0, 0.594059405940594, 0.9468438538205979),
  ('Adults', 'No'): (0.0,
   0.9501661129568105,
   0.594059405940594,
   0.04983388704318941),
  ('Children', 'Yes'): (0.599009900990099,
   0.0,
   0.29702970297029707,
   0.8970099667774086),
  ('Children', 'No'): (0.599009900990099,
   0.9003322259136212,
   0.29702970297029707,
   0.09966777408637871),
  ('Infants', 'Yes'): (0.900990099009901,
   0.0,
   0.09900990099009899,
   0.39867109634551495),
  ('Infants', 'No'): (0.900990099009901,
   0.4019933554817276,
   0.09900990099009899,
   0.5980066445182723)})
x: np.ndarray = np.array([1, 2, 3])
print()