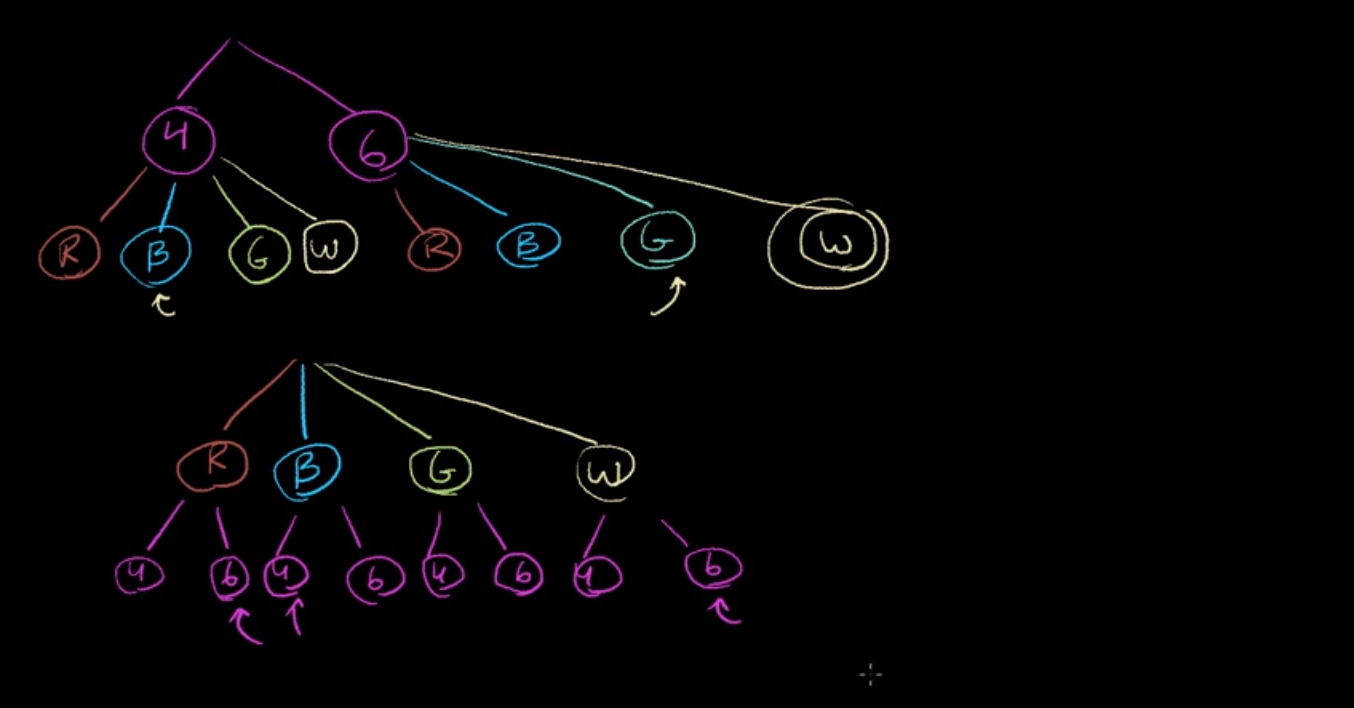
01 Count outcomes using tree diagram
01 Count outcomes using tree diagram#
%%html
<iframe width="700" height="400" src="https://www.youtube.com/embed/Zxvc6iPKdec/" frameborder="0" allowfullscreen></iframe>
import itertools
import numpy as np
import pandas as pd
from pandas import Series, DataFrame
import matplotlib.pyplot as plt
import seaborn as sns
import networkx as nx


engines = ['4', '6']
colors = ['Red', 'Blue', 'Green', 'White']
tree = [i for i in itertools.product(engines, colors)]
tree
[('4', 'Red'),
 ('4', 'Blue'),
 ('4', 'Green'),
 ('4', 'White'),
 ('6', 'Red'),
 ('6', 'Blue'),
 ('6', 'Green'),
 ('6', 'White')]
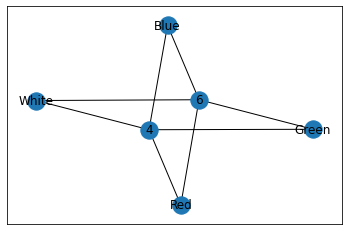
G=nx.Graph()

for engine, color in tree:
    G.add_edge(engine, color)

nx.draw_networkx(G)
plt.show()

# find a better way to plot tree diagram

